Periods Comparison
- 20 Feb 2023
- 1 Minute to read
- DarkLight
- PDF
Periods Comparison
- Updated on 20 Feb 2023
- 1 Minute to read
- DarkLight
- PDF
Article summary
Did you find this summary helpful?
Thank you for your feedback!
This report is designed to show how alerts and incidents change over successive periods.
On each tab, you can select the kind of time period you wish to compare: Quarter, Month, Week, or Day. Depending on the selection, a combo box gives the ability to select the most recent such period to use as the basepoint for the comparison. The report will then show the data for this selected period, and compare it to the three matching previous periods. So, for example, if the period selected is Month, and May, the report will show data for February, March, April, and May.
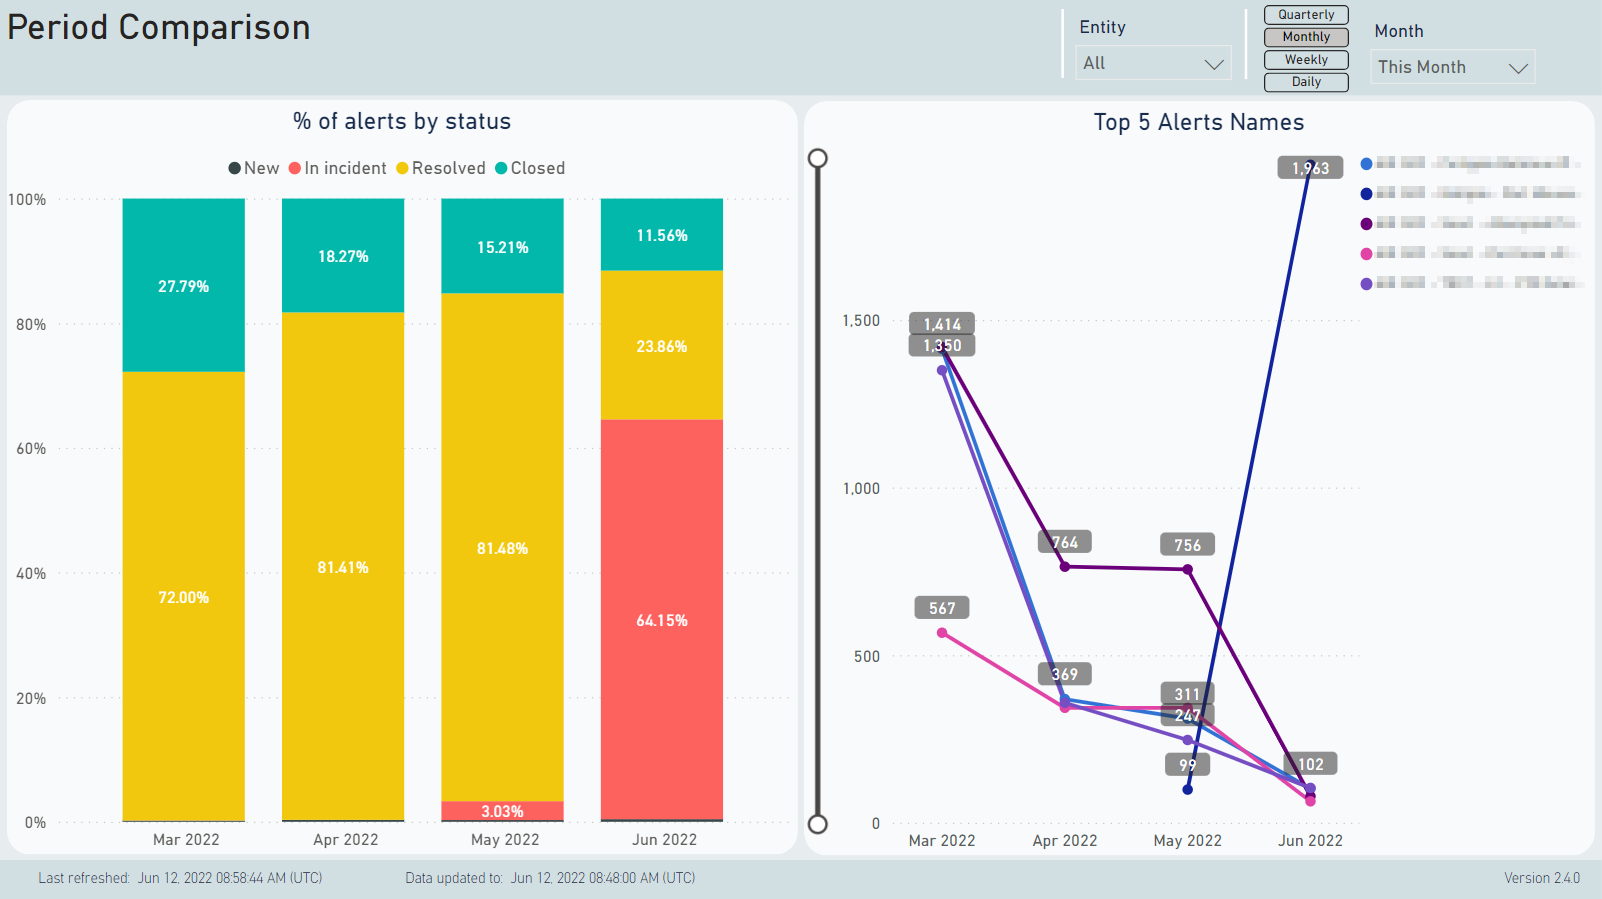
Alerts Comparison
This tab shows the statuses of the alerts opened in each period, as they were at the end of each period. This allows you to see if there is any degredation in the performance of the SOC team in investigating, resolving, or closing alerts on a period-by-period basis.
It also shows the top 5 alerts by rule over each of the 4 periods, allowing you to see if there is any trend or change in which alerts are being received, as well as how many of each type.
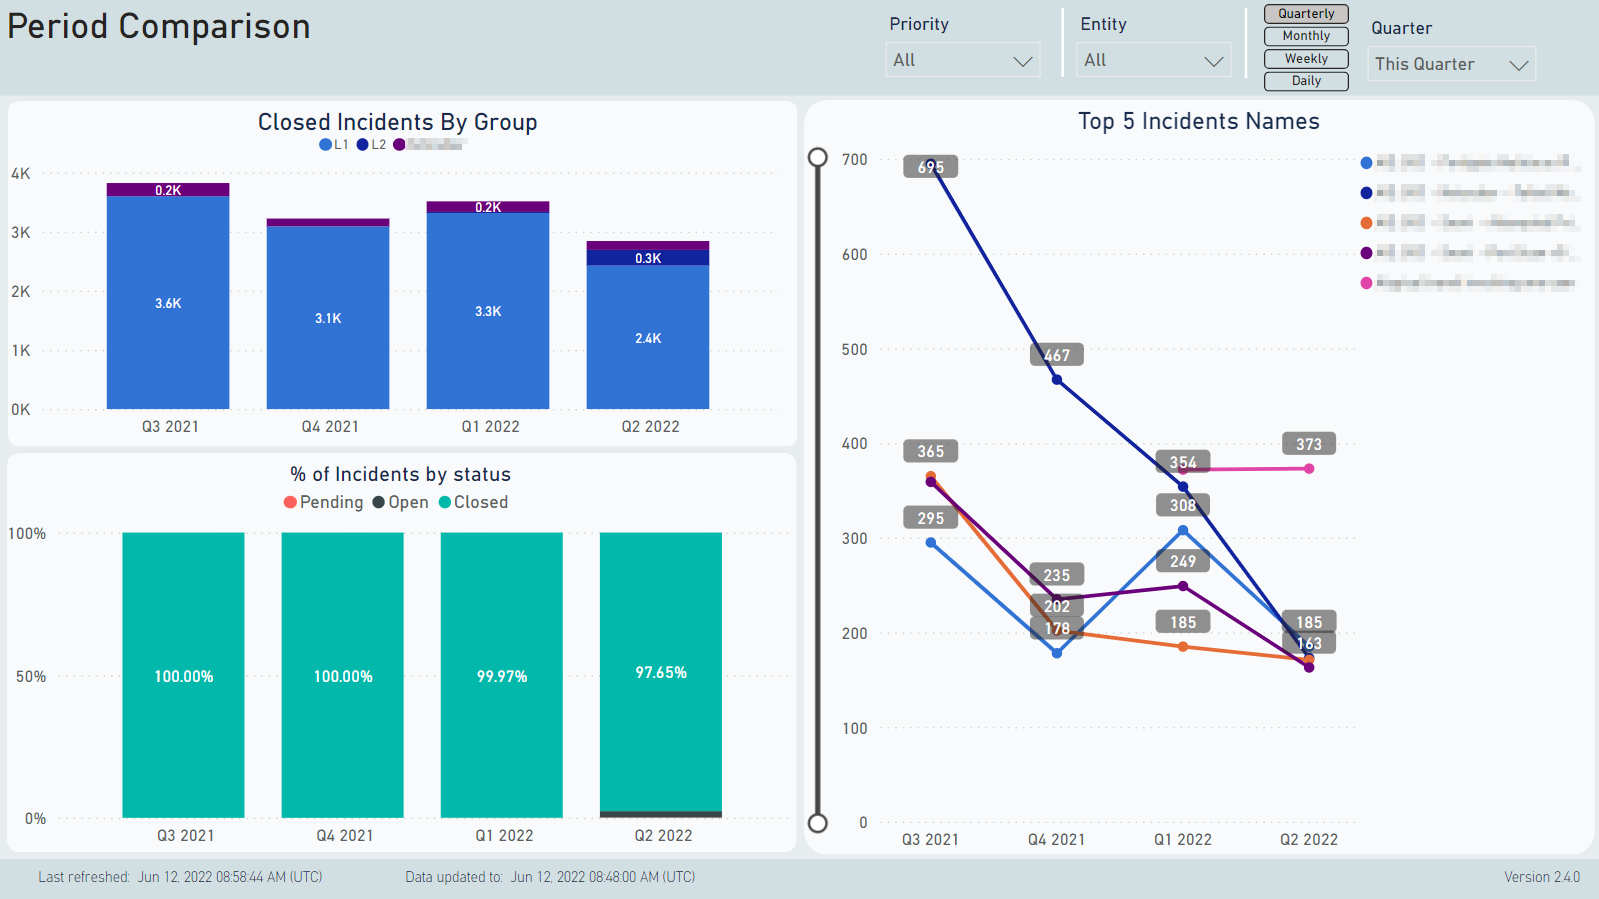
Incidents Comparison
This tab shows the percentage of incidents in each status (Closed/Open/Pending) at the end of each period. As with the Alerts Comparison, this allows you to see if there is any degredation in the performance of the SOC team in investigating, resolving, and closing incidents on a period-by-period basis.
It also shows the number of incidents closed by each SOC group (L1/L2/customer) for each period.
Was this article helpful?