Incidents
- 11 May 2023
- 3 Minutes to read
- DarkLight
- PDF
Incidents
- Updated on 11 May 2023
- 3 Minutes to read
- DarkLight
- PDF
Article summary
Did you find this summary helpful?
Thank you for your feedback!
The Incidents report includes multiple tabs related to incidents.
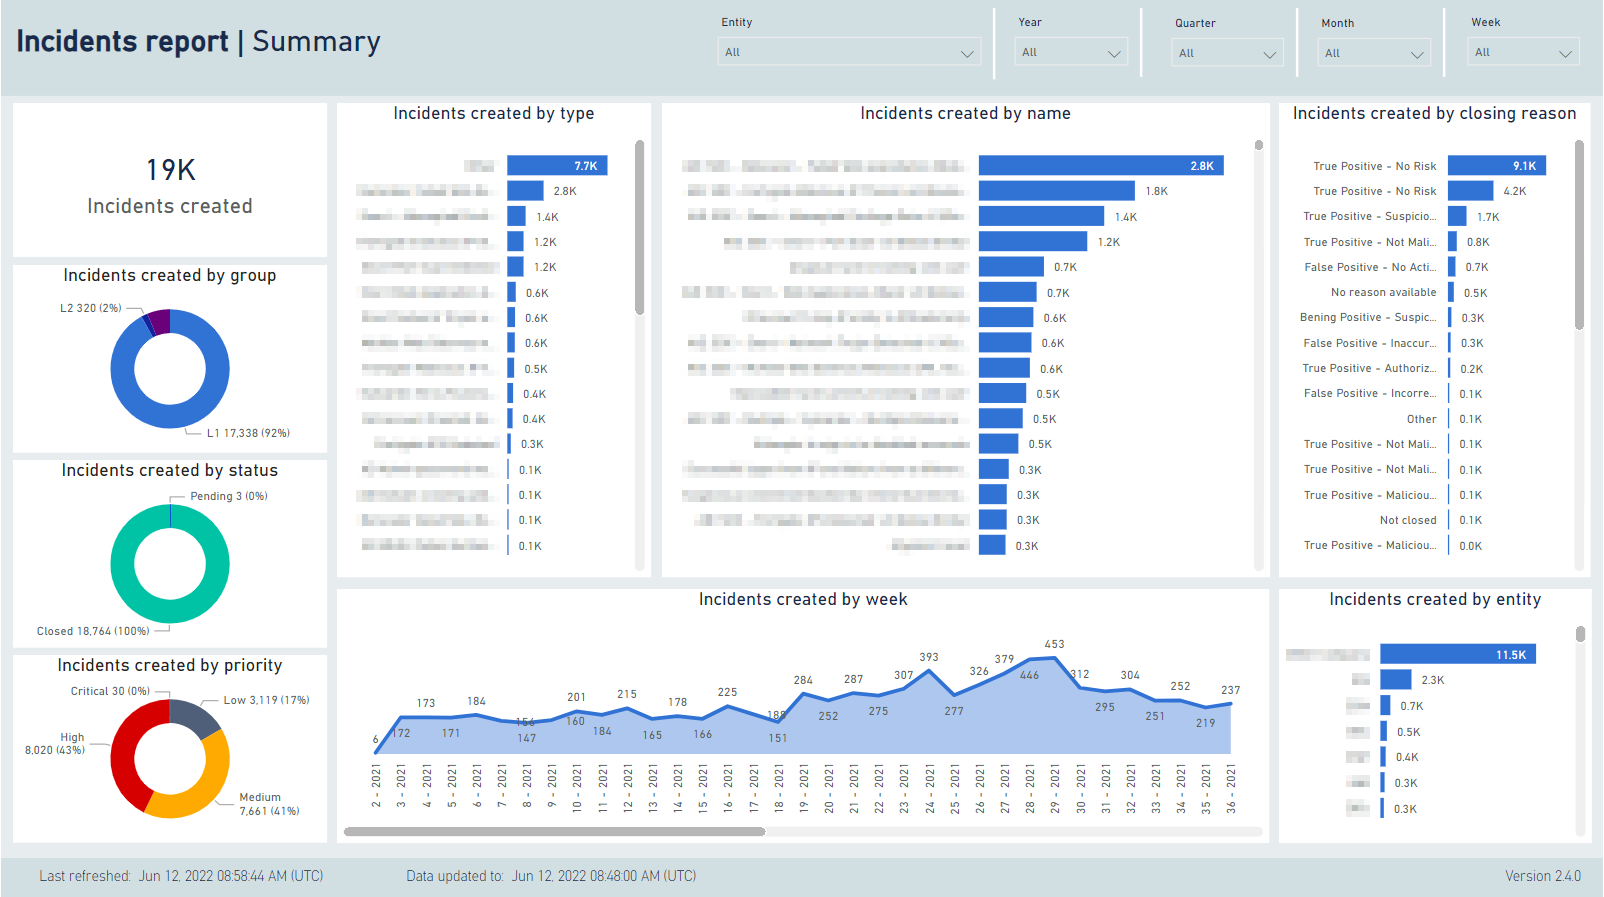
Summary
This tab is intended to give a high-level overview of the incidents created during the selected period, viewed in multiple ways:
- Total number of incidents
- Total by group
- Total by status
- Total by type
- Total by name
- Total by closure reason
- Total over weeks
- Total per entity (some customers have different companies managed within a single CDC, and alerts can be tagged with this information).
The graphics are interactive, so you can click on a pie chart, for example, and then all of the graphics and data are updated to show alerts with the selected severity only.
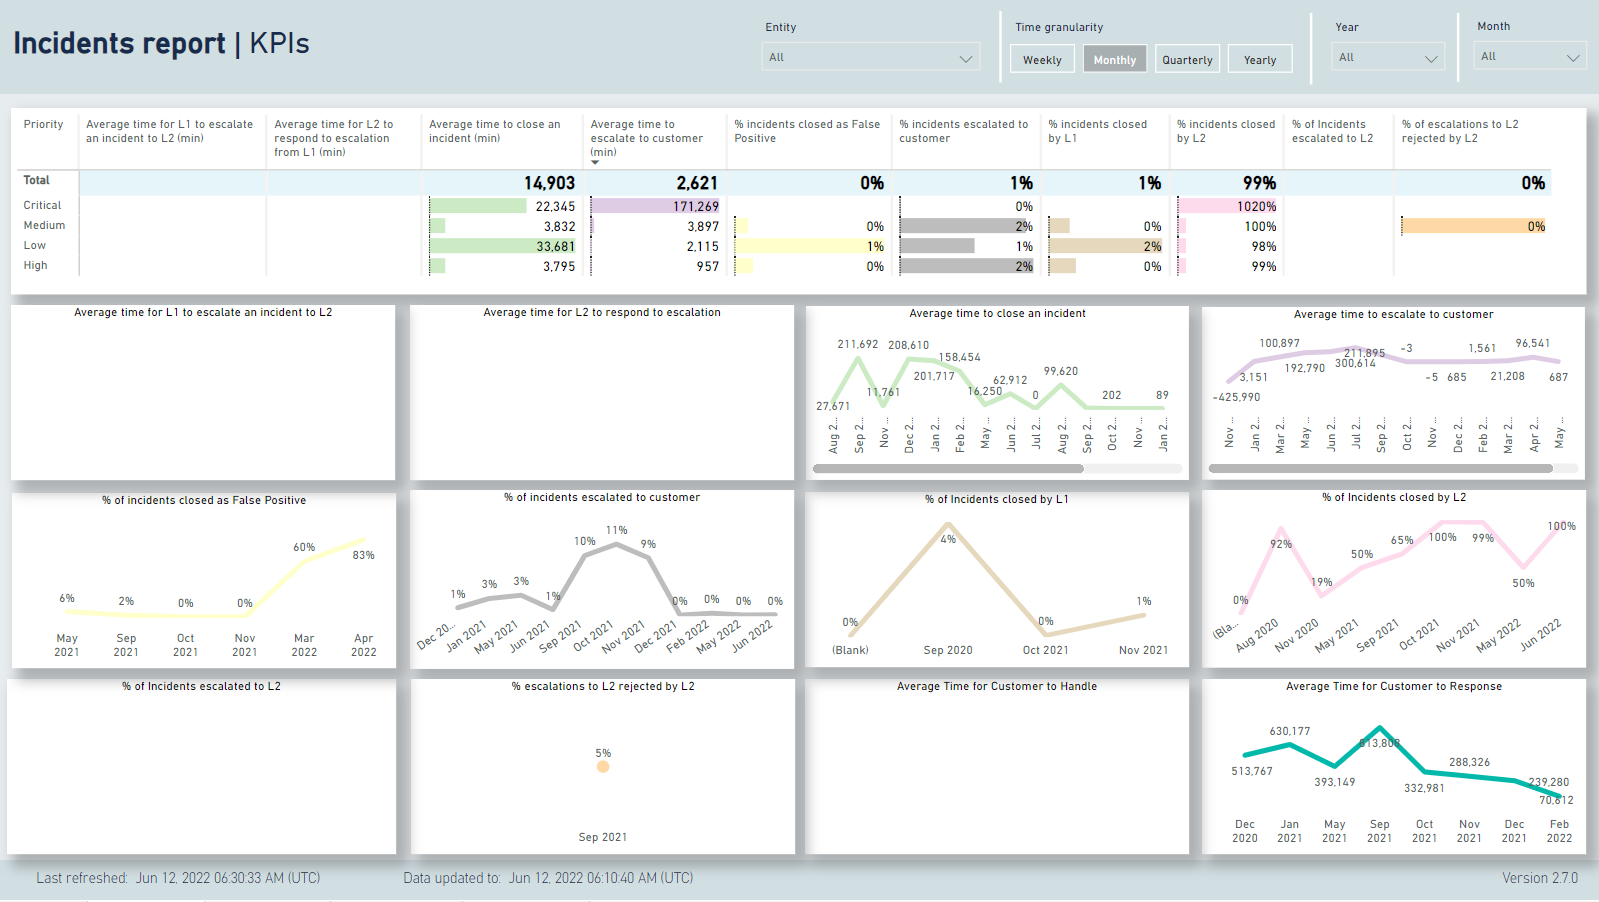
KPIs
This tab is intended to give a time-trend overview of key incident-related KPIs:
Incidents Performance KPIs
- Average time to close an incident – time from incident creation to final incident closure, for all incidents closed during this time period.
- Average time for Level 1 to escalate an incident to Level 2 – time from incident creation to first incident escalation, for any incidents escalated from L1 to L2 during this time period.
- Average time for Level 2 to respond to escalation from Level 1 – time from L1 escalation until L2 accepts or rejects the escalation, for any incidents escalated from L1 to L2 and accepted or rejected by L2 during this time period.
- Average time to escalate to customer – time from incident creation to incident escalation, for any incidents escalated to the customer during this time period.
- Percent of incidents closed as False Positive – incidents resulting in a false positive during this time period, as a percentage of all incidents closed during this time period.
- Percent of Incidents closed by Level 1 - incidents closed by L1 during this time period for any reason, as a percentage of all incidents closed during this time period.
- Percent of incidents escalated to Level 2 - incidents escalated to L2 during this time period, as a percentage of all incidents that were open at L1 at some time during this time period.
- Percent of incidents escalated to Customer - incidents escalated to the customer during this time period as a percentage of all incidents that were open at some time during this time period.
- Percent of escalations to Level 2 rejected by L2 - for any incidents escalated to L2 and rejected by L2 during this time period, as a percentage of all incidents escalated to L2 and rejected or accepted during this time period.
- Percent of incidents closed by Level 2 - incidents closed by L2 during this time period for any reason, as a percentage of all incidents closed during this time period.
- Number of incidents created during the time period.
- Number of incidents closed during the time period.
- The time filters allow for selecting the time period to be included in the report. All of the KPIs relate to when the relevant event occurs to the incident, irrespective of when the incident was opened.
- Average time for customer to handle - average time that the incident was open on the customer, from when the escalation to the customer was accepted, until it is re-assigned to another group, or closed. All incidents which ended their stay with the customer during this time period are included in this average. In cases where the incident moves more than once to and from the customer, this counts the total time it is open on the customer.
- Average time for customer to accept or reject escalation - average for all incidents whose escalation to the customer was accepted or rejected during this time period.
The Priority graphics are interactive, so you can click on one of the rows, and then all of the graphics and data are updated to show incidents with the selected priority only.
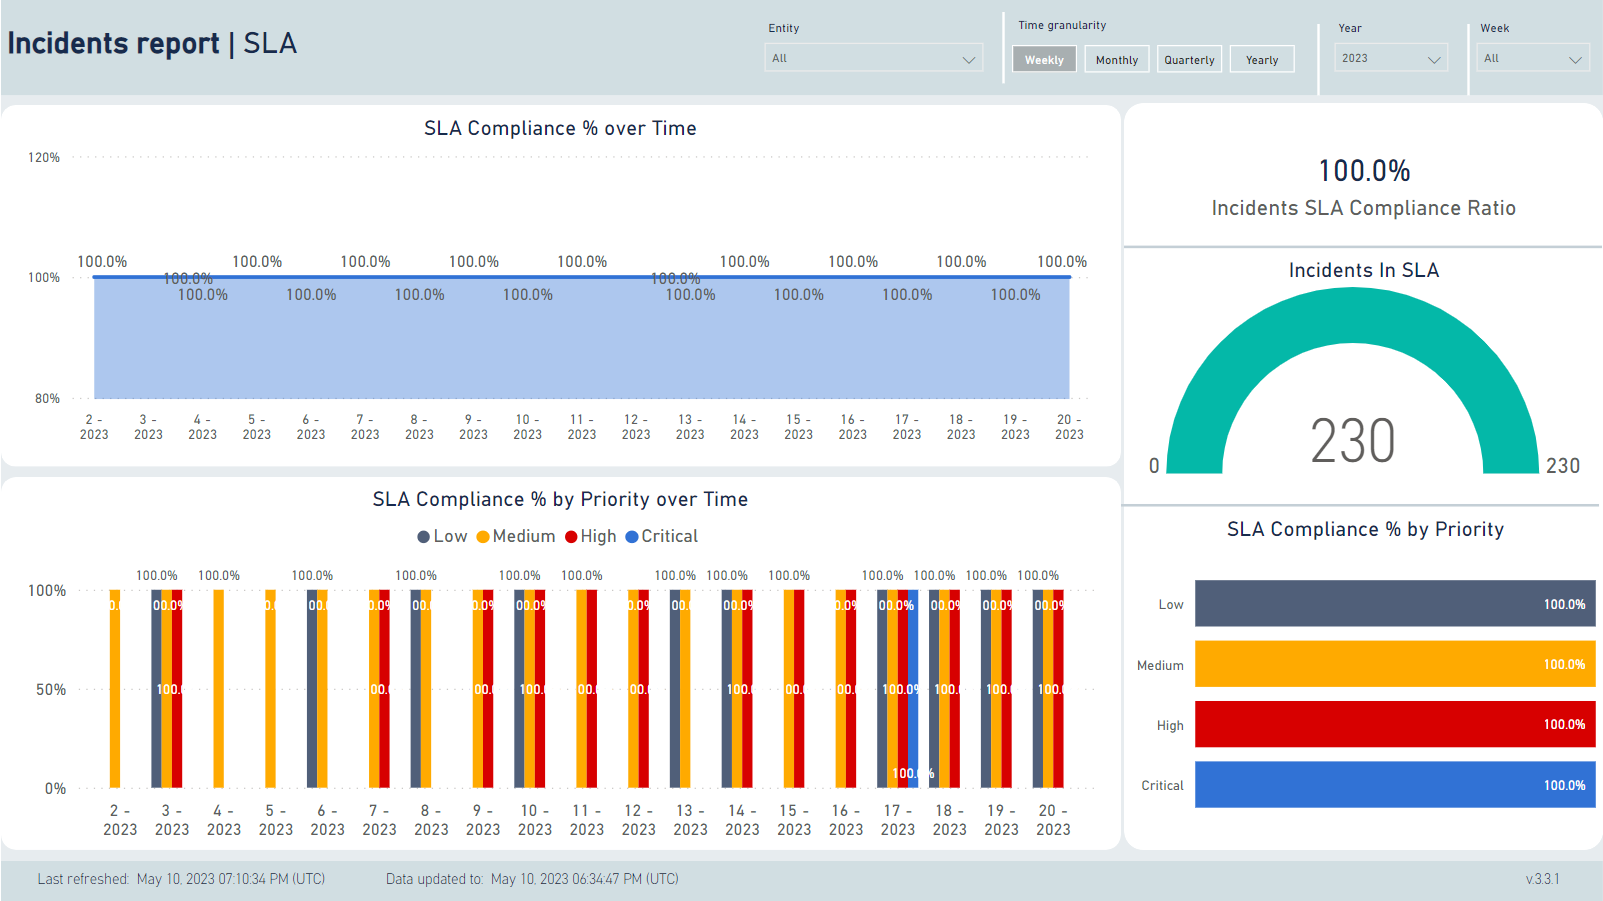
SLA
From CDC 3.3 onwards, incidents also have SLA requirements, based on the SLAs of the alerts attached to them. The compliance of the incident handling with this SLA is shown in this report.
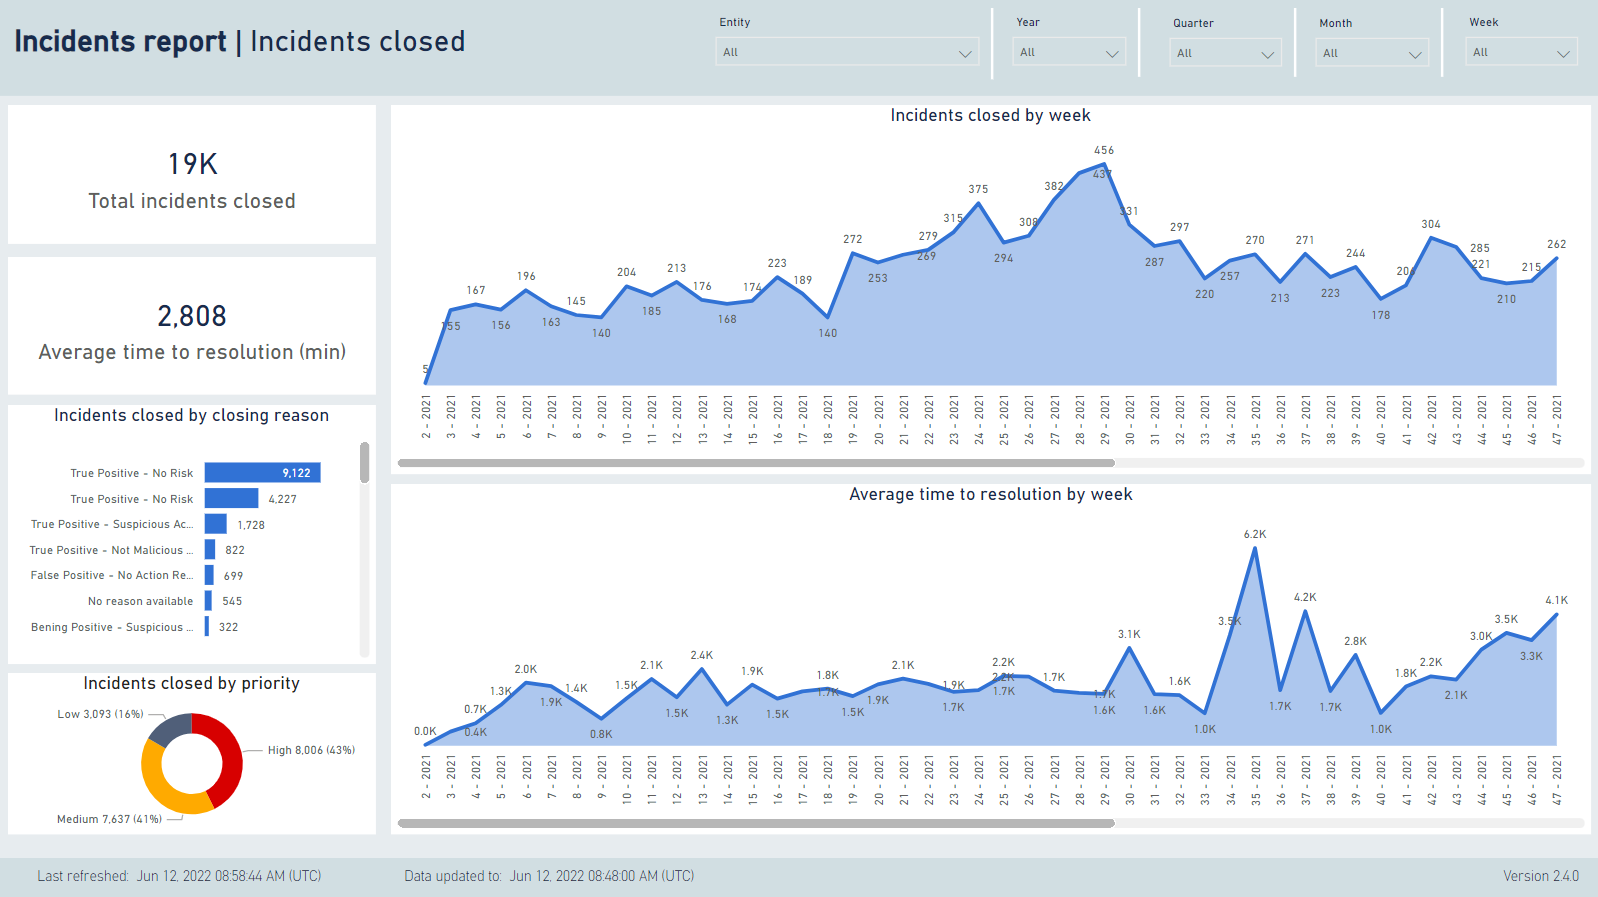
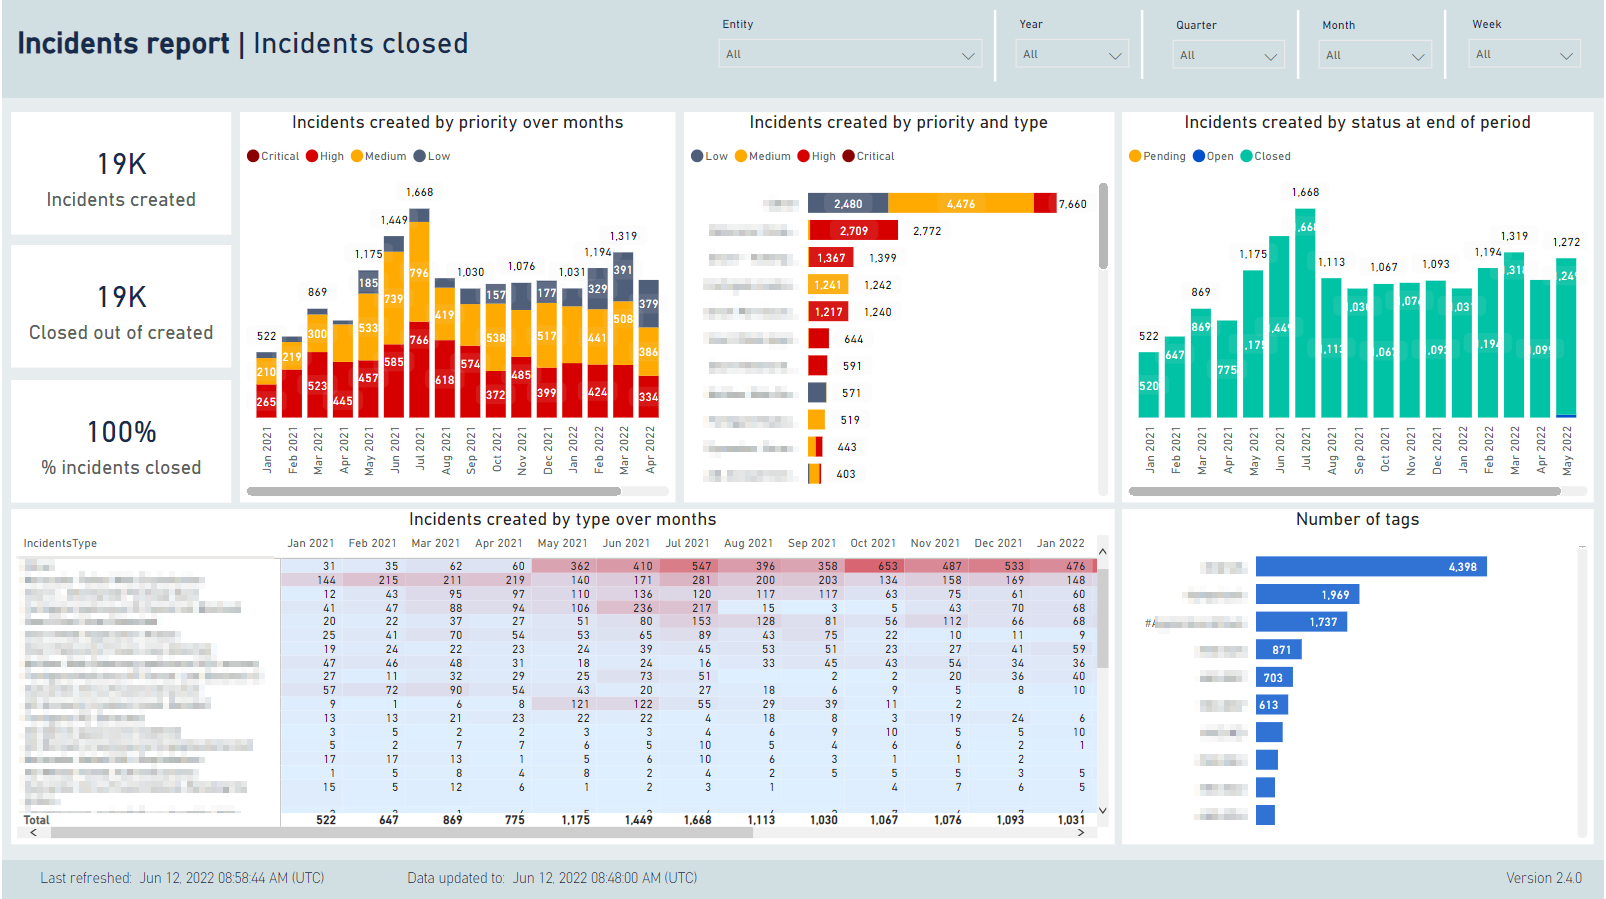
Incidents Closed
This tab gives a high-level overview of the incidents closed during the selected period.
Incidents Analysis
This tab gives a breakdown of the incidents created during the selected time period, into multiple different views, to enable identification of trends, and SOC performance over time.
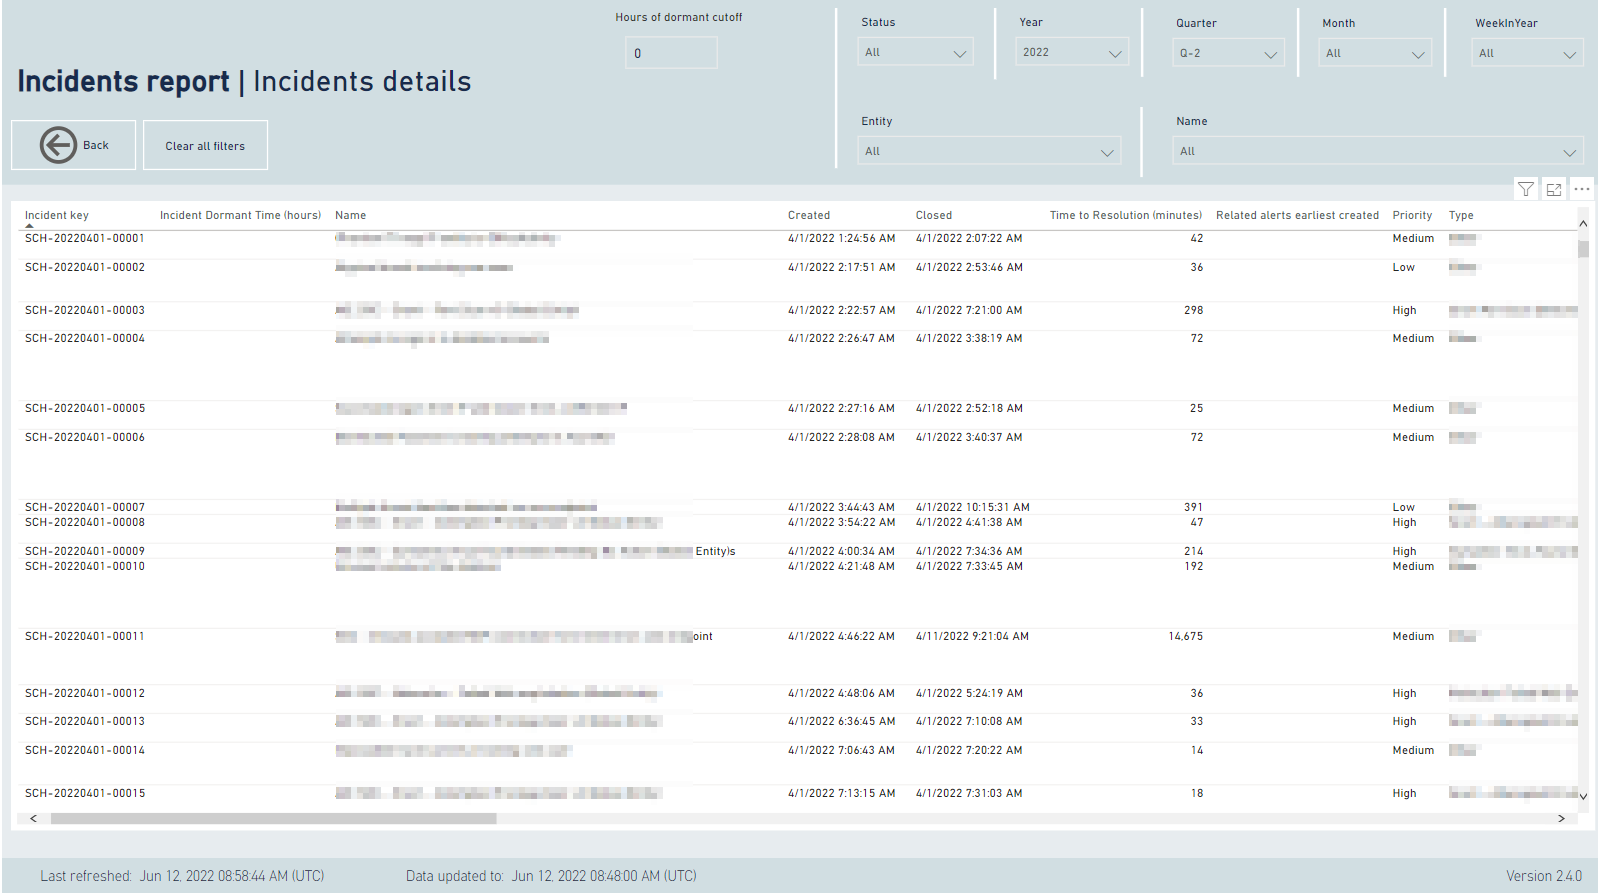
Incident Details
This tab is a large table with the following data:
- Incident ID (key)
- Incident Dormant Time
- Incident Name
- Date/Time Created
- Date/Time Closed
- Time to Resolution
- Related Alerts Earliest Creation Time
- Priority
- Type
- Status
- Owner
- Owner Company
- Group
- Closing Reason
- Severity (until version 3.2, but removed from 3.2 onwards)
- Closing Comment (Summary)
- External Ticket ID
- First Redirection to Customer
- Time from Creation to First Redirection
- Tags
- Entity
- Link (to CDC Incident)
The time filter will show incidents created during the selected period.
Was this article helpful?