Incident Handling
- 26 Feb 2023
- 19 Minutes to read
- DarkLight
- PDF
Incident Handling
- Updated on 26 Feb 2023
- 19 Minutes to read
- DarkLight
- PDF
Article summary
Did you find this summary helpful?
Thank you for your feedback!
Incident Dashboard
The Incident dashboard includes a detailed list of incidents, usually created from specific alerts. An incident is accompanied by the gathering of additional information such as observables about the event - as well as descriptions of actions in response to the incident, either by SeeMo or CyberProof analysts. Additionally, each incident, depending on its type or observables tag, could include one or more playbooks indicating the flow for handling the incident.
Incidents are initially handled by the Level 1 SOC teams according to the playbook flow. Sometimes this flow requires escalating an incident to Level 2 SOC team analysts for handling. Otherwise, L1 analysts will continue to follow the playbook flow and involve whoever is necessary, perhaps adding enrichments, and then work to mitigate and close the incident or mark it as a false positive.
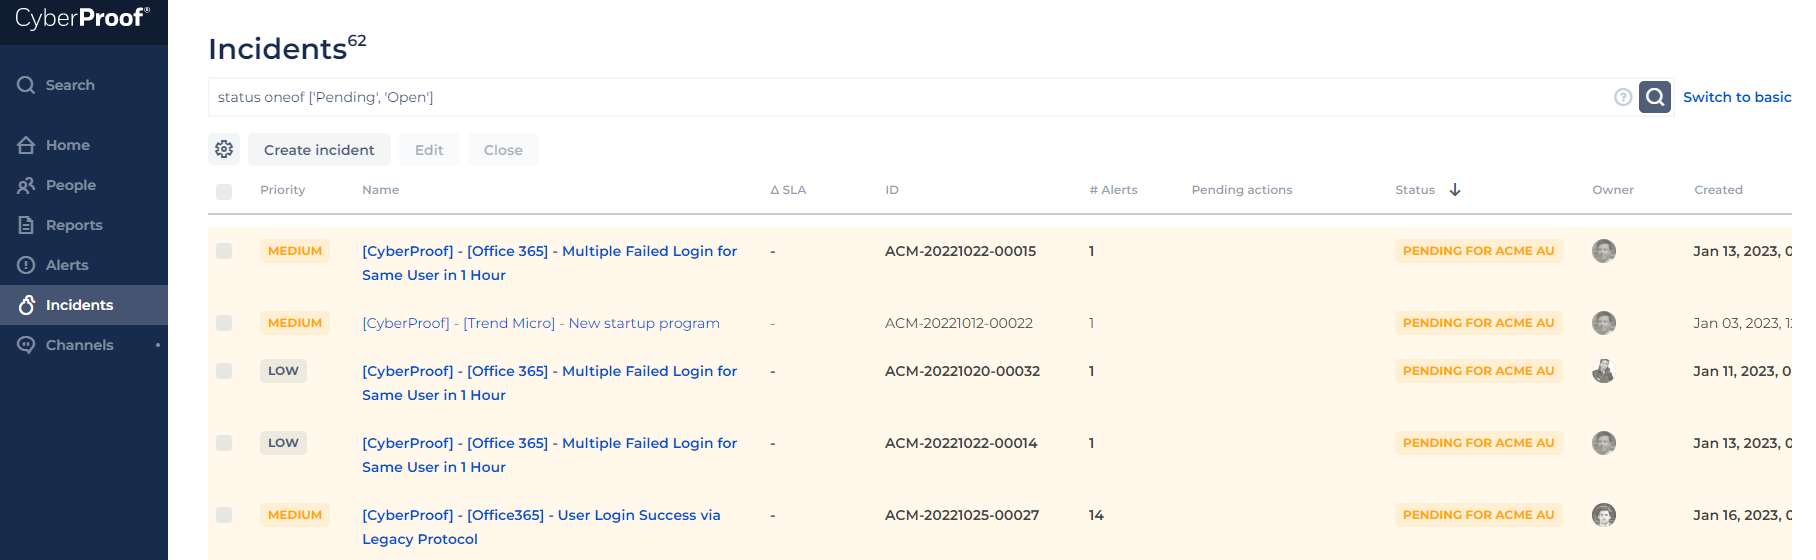
Searching and Filtering From the Incidents List
Searching:
Search specific items from the Search window. The search window is not case-sensitive. You can search alerts by additional fields, such as Source ID, External ID, and more. The search also supports special characters and partial strings.
Filtering:
- Click the Filters button to view filtering options in a dedicated side window:
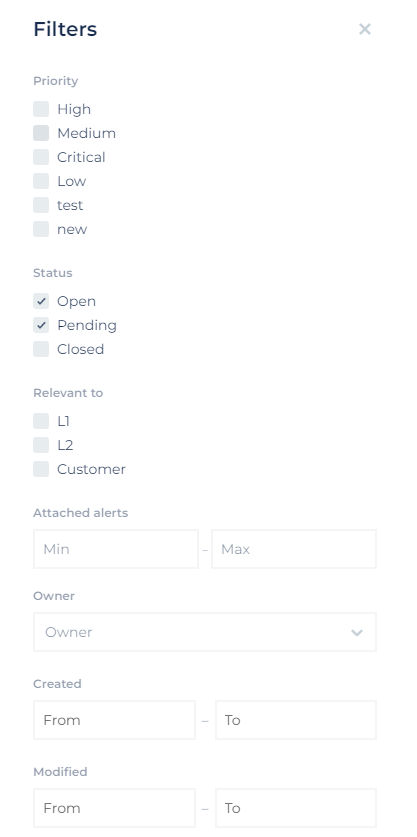
- Priority: Select one or more: Low, Medium, High, Critical, Custom.
- Status: Select one or more: Open, Pending, Closed.
- Relevant to: Select one or more; options will vary - L1, L2, or Customer.
- Attached alerts: Set a minimum and maximum number of attached alerts.
- Owner: Search the Incident owner – responsible for handling and closing the incident.
- Created: Select and set the time range for when the Incident was created. Define the date and time. The time option also offers a Today button, which populates today’s date and the current time.
- Modified: Select and set the time range for when the incident was modified. Define the date and time.
Note: You can click on the year’s number or the month’s name to offer a range or list of years/months to select from. Clicking on the year and selecting the year will automatically advance to the month selection.
Note: You can copy and paste the detection time and date in filters, both in the "From" and "TO" fields. To copy, click CTRL+A and CTRL+C. To paste, click CTRL+A and CTRL+V.
- Type: Select the Incident Type from the drop-down box.
- Tags: Select an existing tag from the drop-down box.
- You can also add a new Tag name simply by typing it in the box.
Add <NewTagName>
Simply click Enter to add it.
- Company Division: Select the company division you want to filter the incident by.
- Members: Select a team member to filter the incident by.
Select the items you want to filter by and press Apply.
- Selected filtering items are displayed in a dedicated window indicating the available or used filtering options.
- Continue to sort columns (ascending/descending) as needed, by clicking their column headers.
- Selected filters here are saved even after you refresh (F5) the page or log out from the platform. You will not have to select them each time from the beginning.
Incident Page
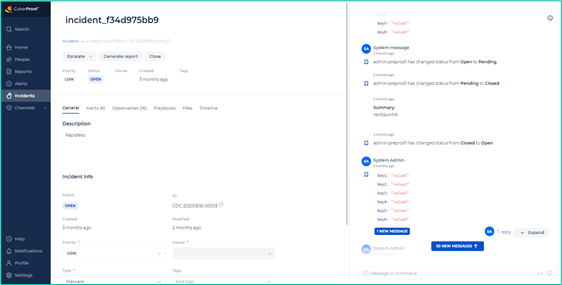
The Incident page has all the information related to the incident. This is where you edit and handle the incident. The page is divided into the following sections:
- Upper left section - for Incidents Handling and includes basic details about Incident such as the Priority, Status, Owner and related tags for the incident, as well as when the incident was created and its associated company division.
Here you can also:
* Escalate an incident.
* Generate an incident report.
* Close an incident,
- Lower left section – the Incidents Details screen divided into its different tabs.
- Right-side section – the Message Board Summary Window and the ChatOps window.
Creating New Incidents
Click Create incident to open its window:
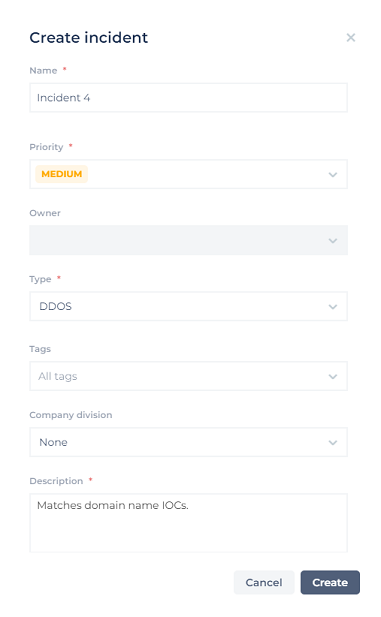
Continue to populate the window with the required information:
- Add a name and description for the new incident (required).
- Define the Priority, Owner, and Type for the new incident as well as a short description.
*Tip: Add a tag to the incident. Regardless of how similar incidents are, they cannot be combined. Therefore it is useful to use the same tag name for similar incidents. - Select the Company Division to which this alert is associated. What you select here will affect your status in the Incidents window. For example, if you are a System Admin you can create an incident with the status of ‘Open in L2’ because you’re a user from the L2 group/company division. You can then escalate the incident to another group. Once you do, the Status will change (for example to L1 if it was escalated to the L1 group).
- Click Create Incident to save your changes or Cancel to discard your changes and close the window.
Escalating Incidents
The CDC platform provides an Incident escalation workflow that allows for uniform team operation throughout teams and locations. Every step in the reveal, respond and mitigate offense/defense line is tracked within the Incident Timeline.
- You can assign incidents to a group (e.g., Escalate to L1, L2) and/or user. (Note that L2 users have more rights. If you are an L1 user, you would not have the ability to assign an incident to another user, only redirect incidents to the whole group).
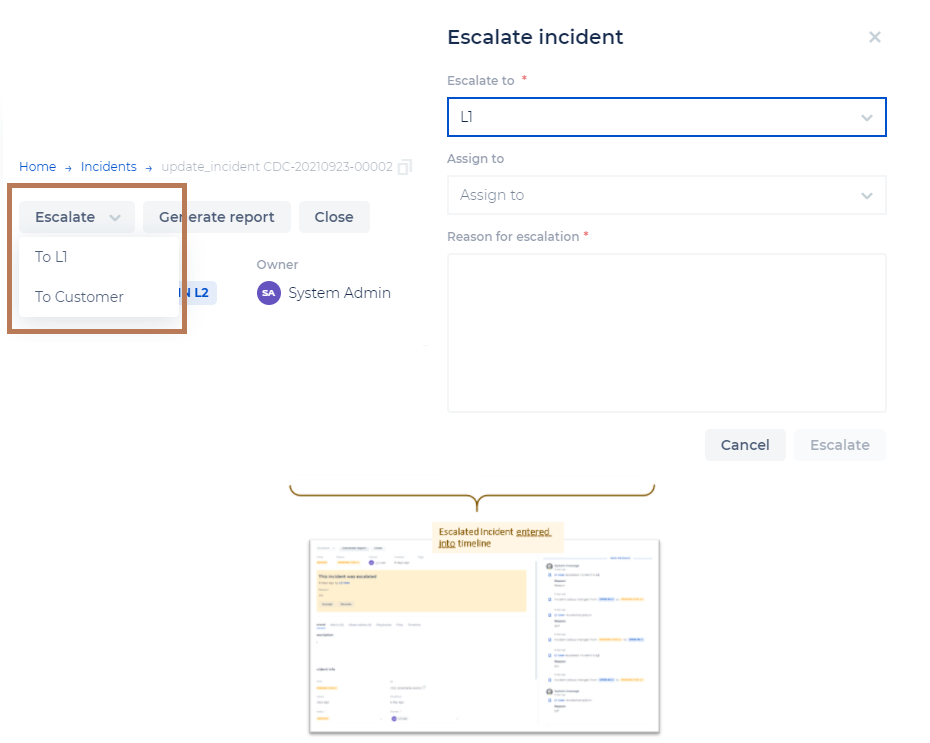
Once the incident is escalated and entered into the timeline, it will show as ‘pending’ for the user/group that has to accept the escalation. Somebody from that group will have to then accept the escalation and take ownership of it. Only a user from that group can accept the escalation. Once the incident is accepted, the status will change from ‘pending’ to ‘open’ within that group.
This escalation can also be revoked by the user who escalated it or by that group. This can happen for example when an incident is not relevant, or if it was a mistake to escalate the incident. Once the escalation is revoked, it returns to the group it was previously in, and all events are updated.
- You can define the way you want to get notified when something is escalated. This means that you can follow up on an incident that was escalated to a predefined group (for example customers or L2). Customers (or L2) will get an automatic email and reminders whenever an incident was escalated to them.
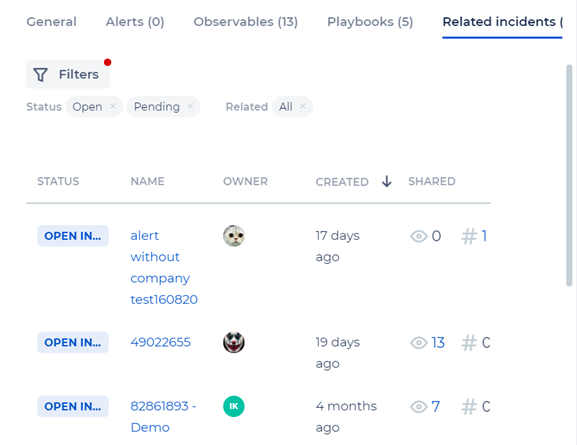
Related Incidents
This shows all the incidents that are related to the current incidents by shared entities (observables). Here you can see the number of shared observables for the incident. You can come here to see how the incident was investigated or handled, as well as additional data. This gives you more context for incident handling.
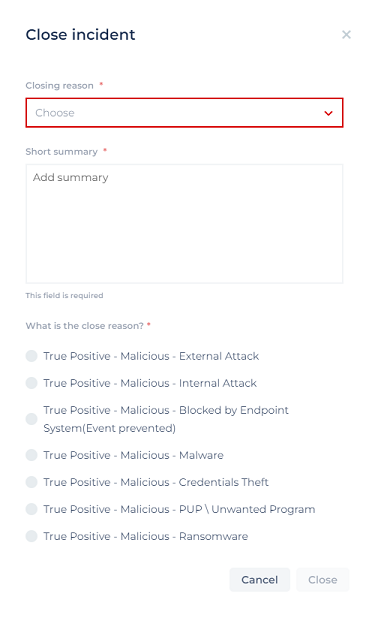
Closing Incidents
After you’ve handled the incident and/or completed all the related playbook steps, you’ll need to close the incident (use the Close button) and choose the reason type. You can also add a short summary of why you're closing the incident.
The following closing reasons are a few examples. There are other closing reasons as well.
- Benign Positive - Suspicious action, but not malicious.
- True Positive - When there is a legitimate attack which triggers to produce an alert.
- False Positive - For cases of incorrect values.
- False Positive - For cases of incorrect alert logic.
- Undetermined - Note that these are the only reasons that cannot be deleted.
The closing reasons are all configurable, other than Undetermined, which cannot be changed or removed.
Note: When closing an incident, the closing reason will be copied to the attached alerts and to the source (SIEM/EDR).
Click the Close button to commit the changes.
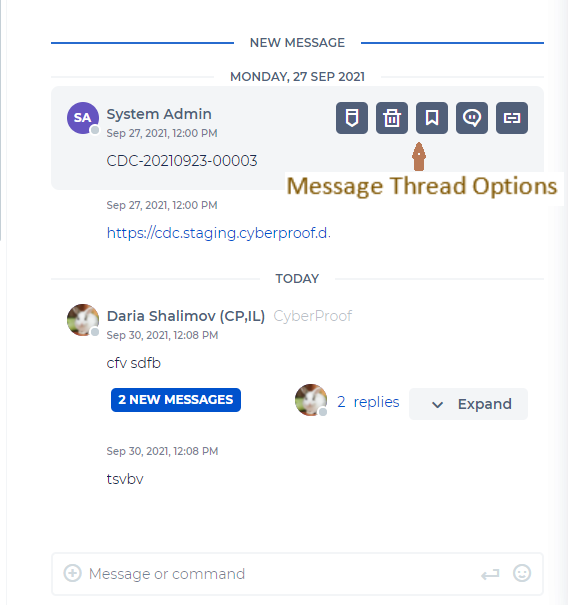
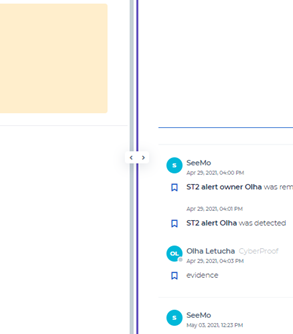
Message Board Summary Window
The Message Board Summary Window is a message board that holds the Incident’s message board and the ChatOps window. The message board includes detailed message handling and communication information in Message threads, collected during the Incident handling, such as redefining the incident status, performing a playbook action, conferring with another team member, etc.
| Name | Icon | Description |
|---|---|---|
| Threads |  | High level toggle icon used to open/close the message thread for the incident. |
| Edit Message |  | Choose a data type for the message and then add a description of the type. |
| Delete Message |  | Delete the message. Only the message owner can delete the message. |
| Mark as Evidence |  | Click to mark this message as evidence. A window opens asking you to define the Evidence Name (required). You can continue to describe the evidence. The marked evidence is timestamped here as well. Click the Upload button to save. |
| Open Message Thread |  | Opens a chat window where you can continue to add messages to this particular thread. |
| Copy Link to Clipboard |  | Allows you to copy a link to this message thread to the clipboard. It can be used, for example, in an email to other users. |
Incident Details Screen
The Incident Details screen dynamically changes when selecting between the tabs. Each tab relates to a different aspect of the incident, such as General details, Alerts, Observables, etc.
A tab that has populated details will list the number of details in parenthesis next to the tab name. In the example page below, the showcased incident has 6 Alerts, and 16 Observables associated with the Incident, yet it has no associated Playbooks or supporting files.
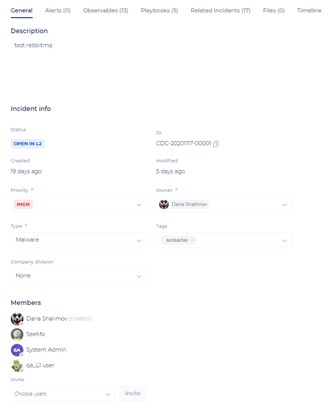
Incident Details - General
The General tab gives detailed information regarding the incident.
The Status, Priority, Type and Tags are defined here for the incident, and can be changed as the incident is handled. Each change is listed in the Incident Summary screen as it occurs.
Mitre ATT&CK
Here you can also get related Mitre ATT&CK information on alerts and incidents, so that you can better analyze and handle a case. Alerts will contain Mitre ATT&CK information such as the ID, and information on the tactic, technique, or sub-technique used in the attack.
The list of tactics and techniques can be changed by the Mitre organization, and the CDC will be updated accordingly. When a change is done in the alert, it will also be reflected in the related incident. Incidents will contain all Mitre ATT&CK information from all alerts.
If a Mitre ATT&CK is part of more than one alert and a change was done in one alert, this change will be reflected in the incident but not in the other alerts that share this information.
Mitre ATT&CKs can be deleted and updated. The attached alerts will be updated automatically. When adding/updating/deleting a Mitre ATT&CK in the incident, the change will not be reflected in the attached alerts.
Incident Details - Alerts
The Alerts tab displays a list of all alerts that are related to this incident. Each alert indicates its name, its score, a suspicious rate (0-100, where 0 is not suspicious and 100 is most suspicious), the date it was detected, and the SLA time given to handle the report. You can filter and sort the alert list as needed.
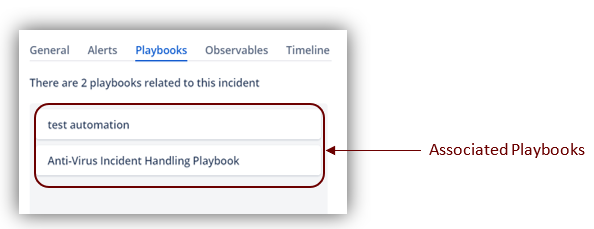
Incident Details - Playbooks
The Playbooks tab lists the playbook(s), if any, required for handling this incident. You must adhere to the playbook flow in order to handle and mitigate the incident properly before closing. Here you can see a counter of how many playbooks you have, and a list of playbooks in different statuses – such as Succeeded, In Progress, and Terminated/Terminating.
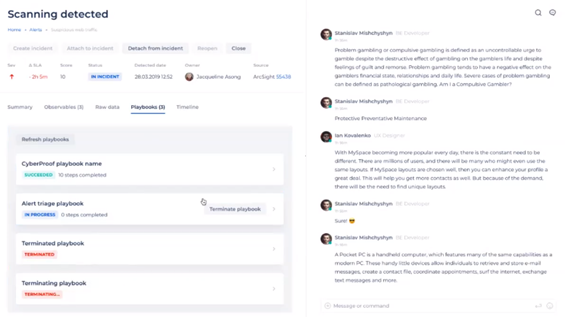
SeeMo attaches one or more related playbooks to incidents depending on the incident’s type and related tag.
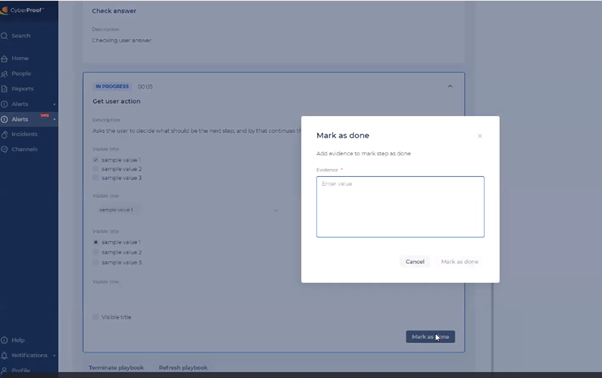
Under the External Playbook tab, click Add playbook to add a link/URL, as well as an associated incident. Note that when you complete this, you will need to mark it as done, to demonstrate that you really completed this step. You can attach a file here or add a comment showing you completed the step with your results. It will be added to the chat and to the timeline as being a completed step.
Note: You can also link/relate an external playbook to more than one use case - rather than having to copy the playbook.
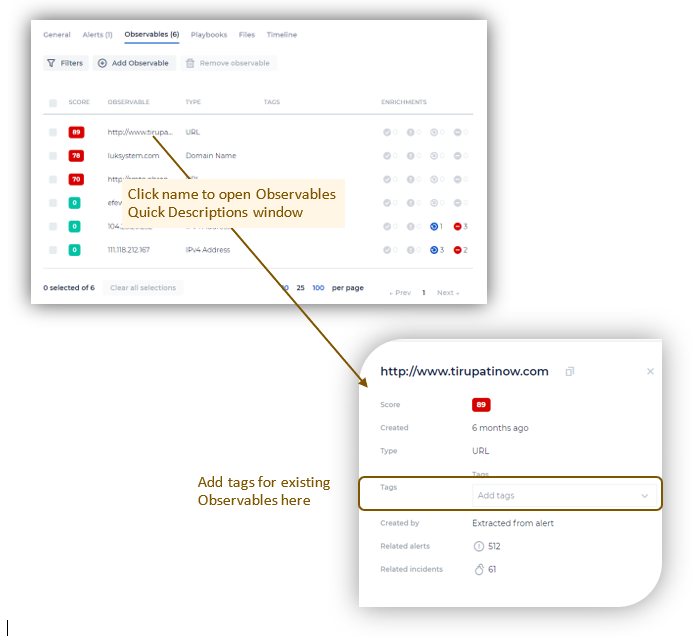
Incident Details - Observables
The Observables tab displays a list of all the observables related to the incident. These can be filtered by the incident type and tag(s).
You can:
- Click on an Observable name to open its Quick Page Window. This is where you can add a tag to describe the Observable and group together the same types of observables regardless of which incidents they are related to. Also, view the Observables Enrichment details in this window. The enrichments are clickable and link to the items.
- Add or remove an Observable item by clicking the Add Observable or Remove Observable button.
- Sort the Observables by clicking on any of their column names.
They can be further filtered or sorted (ascending/descending) by clicking on any of the column names.
Note: Filters here will be saved even after you refresh (F5) the page or log out from the platform. You will not have to select them each time from the beginning.
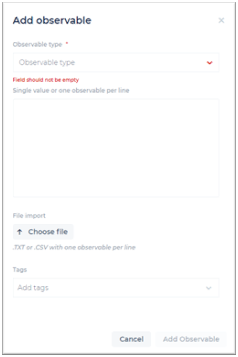
Adding New Observables
Click the Add Observable button to open a dedicated window where you can:
- Select the Observable type from a pre-determined list (required).
- Enter free text descriptions.
- Import one or more files to support the observable.
- Add one or more Tag names for the observable
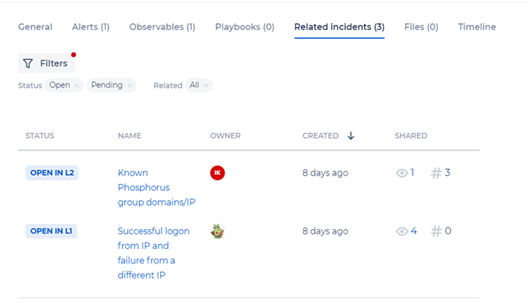
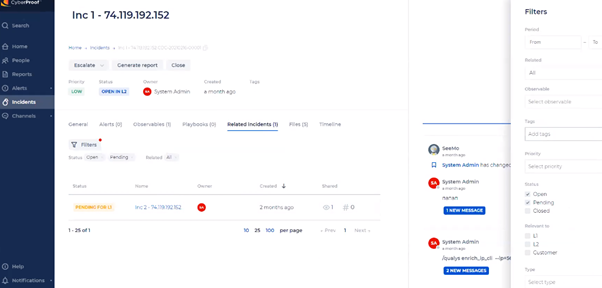
Incident Details - Related Incidents
The Related Incidents tab shows you how many related incidents you have. You can also see the number of observables and tags, and filter the related incidents by status, tags, relevant to, observables, etc.
Incident Details - Files
The Files tab lists all files related to the incident. Files relating to an incident can be downloaded and viewed.
You can copy the File ID in all Files appearances in the CDC. This is an integration that requires uploading a CSV file to an incident, and then providing file details as a parameter to the CLI command.
Users with an Incident/Channel Contributor role (and above) can upload password-protected files to the CDC, to allow for more flexibility with file types. These files will be checked for malicious content.
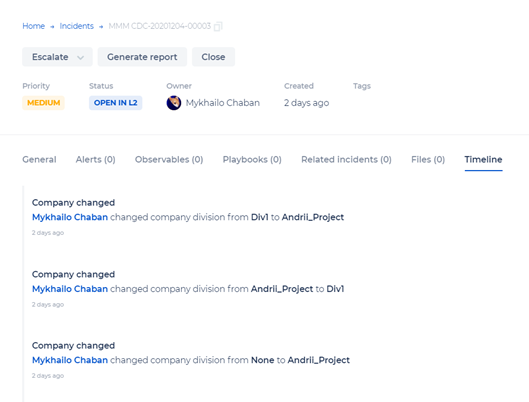
Incident Details - Timeline
The Timeline tab offers a timeline of the major events of the incident handling clearly showing the events leading up to the most current item.
You can:
- Click the Link button to view event details in the Incidents Summary window.
- Click the Delete button to delete an event, if permissions exist.
ChatOps Window
The CDC platform provides ChatOps based collaboration capability to facilitate real-time, cross-team communication and resolution. This allows security analysts and experts from various domains to join into the incident handling and response process, utilizing their expertise collectively to mitigate and recover from incidents effectively and faster.
Use this window to enter a text message or CLI command.
Note: You can increase or decrease the ChatOp window's width by dragging the divider right or left.
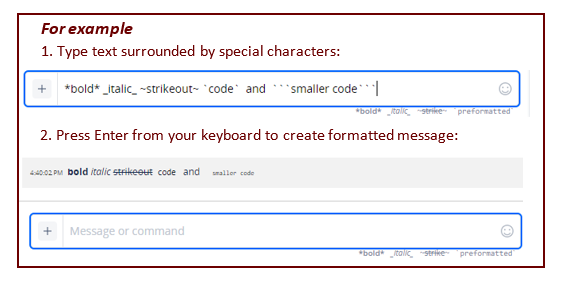
Entering Messages, Text, Files, and/or Web Content
Enter messages in any of the following formats:
• Free unformatted text – directly type in message from your keyboard
• Formatted text – enter text and format using rich text options offered directly under the ChatOps window.
- bold – use an asterisk, *, before and after text to create boldface text.
- italic – use an underscore, _, before and after text to create italic text.
strikeout– use a tilda mark, ~, before and after text to create strikeout text.
preformatted
– use a backtick,` , before and after text to use a courier typeface font.
Useful for distinguishing between a lowercase letter l and the number 1.
*
code
– use 3 backticks,``` , before and after text to type in a smaller serif font.
- Use an emoji by clicking the emoji in the right corner of the window. Different emoji options are displayed for you to pick from.
- Click the + sign (on the left of the ChatOps window) and select one of the following:
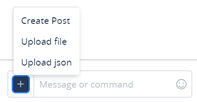
- Create Post – allows you to create formatted text using an advanced text editor that opens in another window.
*** Upload File** – allows you to upload one or more files to this message – opens an explorer window allowing you to browse to the desired location and select the file to upload. You can also do a simple drag and drop from any open folder on your computer directly into the ChatOps window. This action opens another window enabling you to label the file/web content/other with a title, comment and tags. The uploaded files are grouped under one message in the Incident or Channel chat wall. - Upload JSON – allows you to upload a JSON data type or object. Permissions are required to perform this action.
- Drag and drop – you can drag and drop any file from your computer or copy any webpage with formatted styles directly into the ChatOps window. This action opens another window enabling you to label the file/web content/other with a title, comment and tags.
- Mention – Using an @ next to someone's name allows the user being mentioned to be notified and directed directly to that message from their activity center. To @mention a user within an alert/incident, type “@” and the user's name you wish to mention. Click their name when it pops up and continue typing the message. This will send a notification to the user, indicating that they were mentioned.
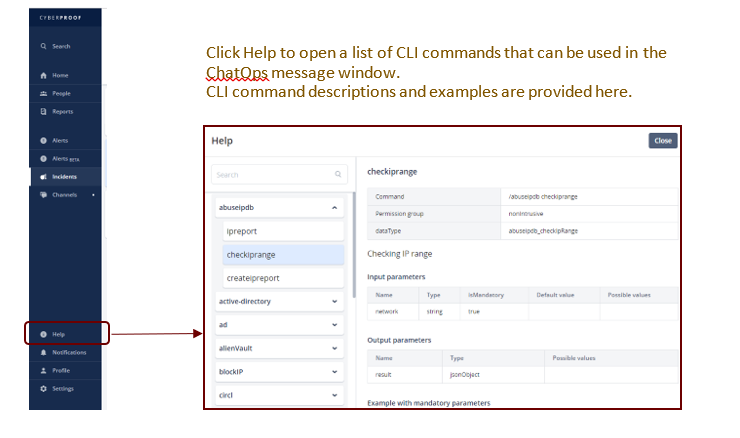
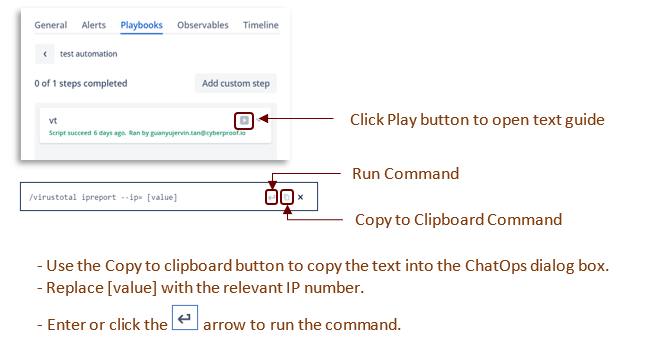
- CLI commands – Enter CLI command via this window, usually at the advice of a playbook. CLI commands are preceded with a forward slash. The autocompletion feature helps guide you as to the correct syntax for the CLI command. Use the CDC dashboard’s Help tab to view a table of all relevant CLI commands and their formatting and syntax requirements.
Handling an Incident for L1 Dashboard
The incident dashboard opens with a list of incidents, similar to the alerts list. Select an incident to handle. 1. Click the Incidents tab to open its dashboard and view a list of incidents. The incidents can be sorted up/down according to any of the column names, by clicking on the column name such as Priority, Name, Status, etc. Additionally, you can use the Filters option to zoom-in on specifics and list by Status type. 2. Click on an incident name to handle. 3. In the Incidents Details - General tab, assign the incident a Status, Severity, and Type. Priority is assigned automatically.
- Priority: Low, Medium, High, Custom: Select a priority for this incident. Usually, the Incident will be given with a defined priority.
- Type: Select the most appropriate type for the incident.
There are many different types of incidents. Select one that best describes the incident. If none of the options are relevant to your incident, then select Other.
Note: Each action taken is listed in the Incidents Summary screen, as it occurs, with a time-stamp and the name of the user handling this occurrence.
You can gain an idea of the incident severity based on its related Alerts (listed in the Incidents Details - Alerts tab) as well as by viewing the incidents Observables (listed in the Incidents Details - Observables tab).
4. If an Incident Playbook exists, consult its steps.
Click on the Incident Details - Playbook tab.
- If no Playbooks are associated with the Incident, continue to handle and close the Incident. You’ll need to define a reason for closing the Incident.
Following the Playbook Steps
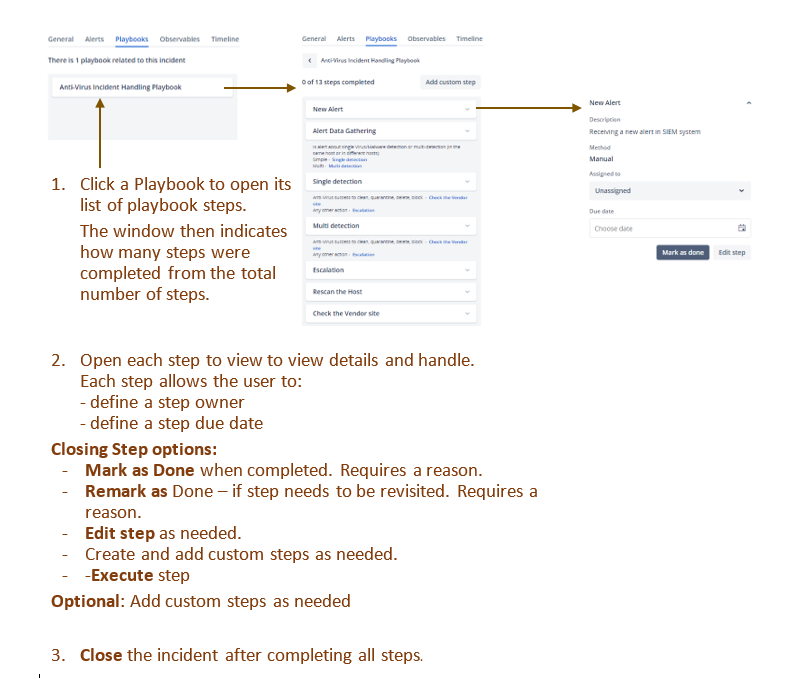
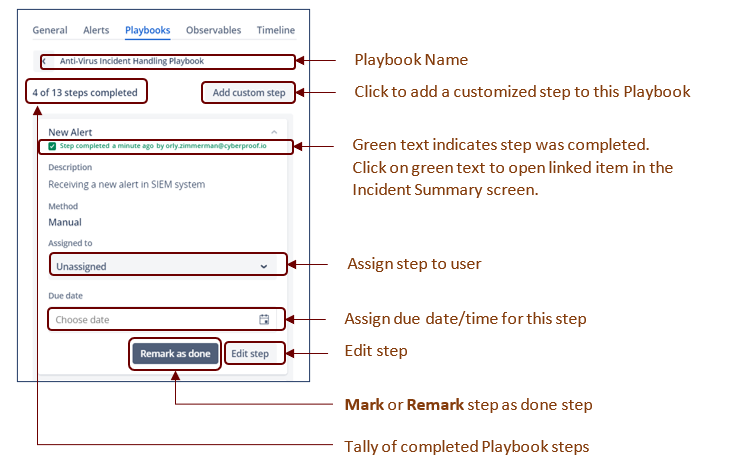
- Click on a playbook to open and view its steps.
- Click on a playbook step to view it and handle the step.
Each step lists descriptions detailing what must be done. Sometimes a step is done automatically by SeeMo or an L1 analyst as needed.
The different steps guide the user as to what needs to be done.
The different possibilities include:
- Assign a user (owner) that is responsible for this step.
- Define a due date for the step.
- Mark the step as done.
- If the step was already marked as Done, but needed to be revisited for any reason, it can be closed again by clicking the Remark as Done button.
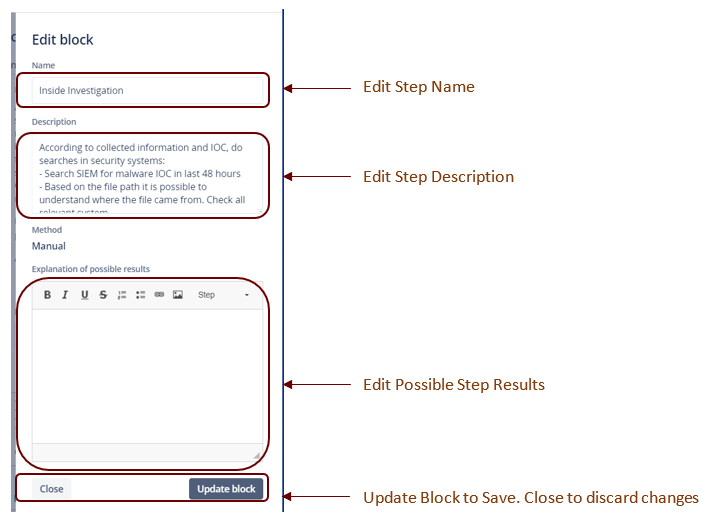
- If needed, edit the step by clicking Edit Step: This opens the Edit Block window populated with the current information for this step. You can redefine the Name, Description, and/or Explanation of Possible Step results as needed.
- Click Update block to save, or Close to dismiss changes without saving.
For steps with this play button
 , a text guide pops up indicating the correct syntax for the CLI, as shown in this example:
- Try and complete all steps. You can work on different steps in parallel.
- Optional: When needed, you can add a custom step to the playbook.
Click Add Custom Step to open the Add Block window and do one of the following:
- Search the different steps
- Select one of the steps already listed in the window by checking its checkbox.
Click Add to Playbook to save your changes or Cancel to discard.
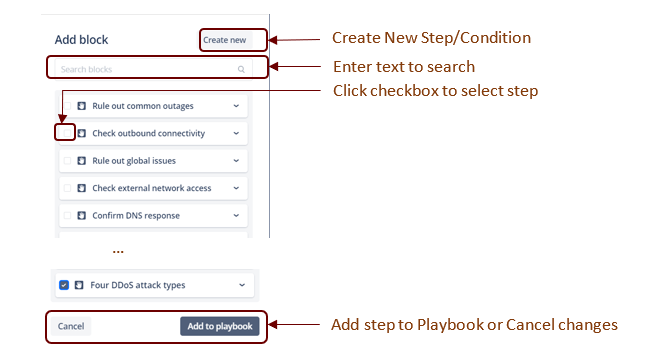
- Create a new step by clicking the Create New button. This allows you to create a new step or add a condition for an existing playbook step.
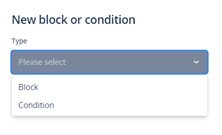
After creating the new step, continue to populate the required information for the new item.
Note: The change you made to this playbook will not update the playbook for the other incidents.
- The playbook steps are tallied as they are completed, so that you know how many have already been completed.
You must complete all playbook steps before being able to close the incident, unless there are other mitigating factors that allow you to close the incident. - Change the incident status (in the General tab) to Closed.
Generating an Incident Report
You can generate a PDF report for an individual incident after selecting a specific incident. 1. Click the Generate Report button on the Incident Summary screen to open a Generate Report window. 2. You can add an Executive summary of the incident or any other information you feel is pertinent to the incident in the Additional Text box. 3. Click Generate report to create the report or Cancel to abort. 4. A PDF report opens on your screen. Download and save the report as needed. The report includes the current Incident information in the following format:
Title page:
- Incident name and type
- CDC Incident ID number and Incident Type
- Name of person generating the report and date/time report was generated.
Executive Summary: The report text begins with the Executive summary which should include descriptive information regarding the incident.
Incident Details: All current incident details such as name, dates, status, type and related tags.
Alerts: Lists details for all the related alerts for this incident.
Members: Lists the incident's member's usernames and their roles.
Playbook: Lists the playbook/s used to handle this incident and lists who completed which playbook task.
Evidence and Timeline: Lists related evidence details for this incident and their associated timeline.
Observables: Lists the Observable details, type and value, for this incident.
Full Incident Handling Corresponding Appendix: Lists all the messages related to this incident, who sent the message and when.
Was this article helpful?