Alerts
- 24 Aug 2022
- 4 Minutes to read
- DarkLight
- PDF
Alerts
- Updated on 24 Aug 2022
- 4 Minutes to read
- DarkLight
- PDF
Article summary
Did you find this summary helpful?
Thank you for your feedback!
The Alerts report includes multiple tabs related to alerts. The report includes a timestamp of the most recent data point included in the report (Data updated to), and a timestamp of when the graphics in the report were last refreshed (Last refreshed). Both of these timestamps are in UTC.
Unless otherwise stated, the time filter will filter alerts created during the selected period.
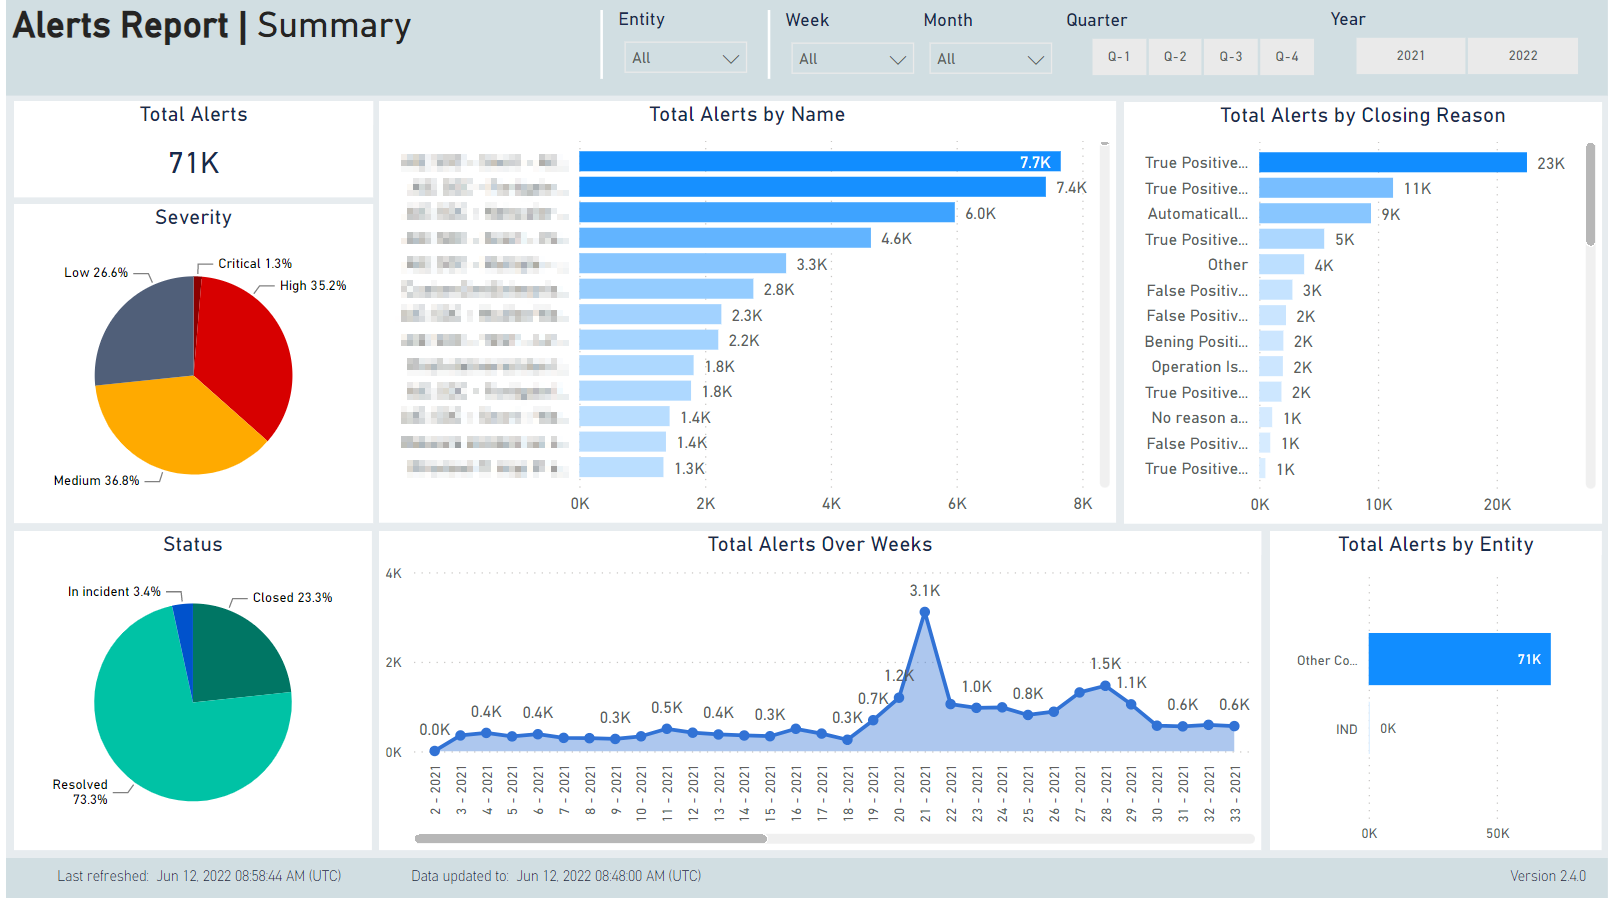
Alerts Summary
This tab is intended to give a high-level overview of alerts, viewed in multiple ways:
- Total number of alerts
- Total by severity
- Total by status (New/In Incident/Closed) - Closed means it was closed as an alert without being attached to an incident.
- Total by closure reason
- Total by name
- Total over weeks
- Total per entity (some customers have different companies managed within a single CDC, and alerts can be tagged with this information).
The graphics are interactive, so you can click on the Severity pie chart, for example, and then all of the graphics and data are updated to show alerts with the selected severity only.
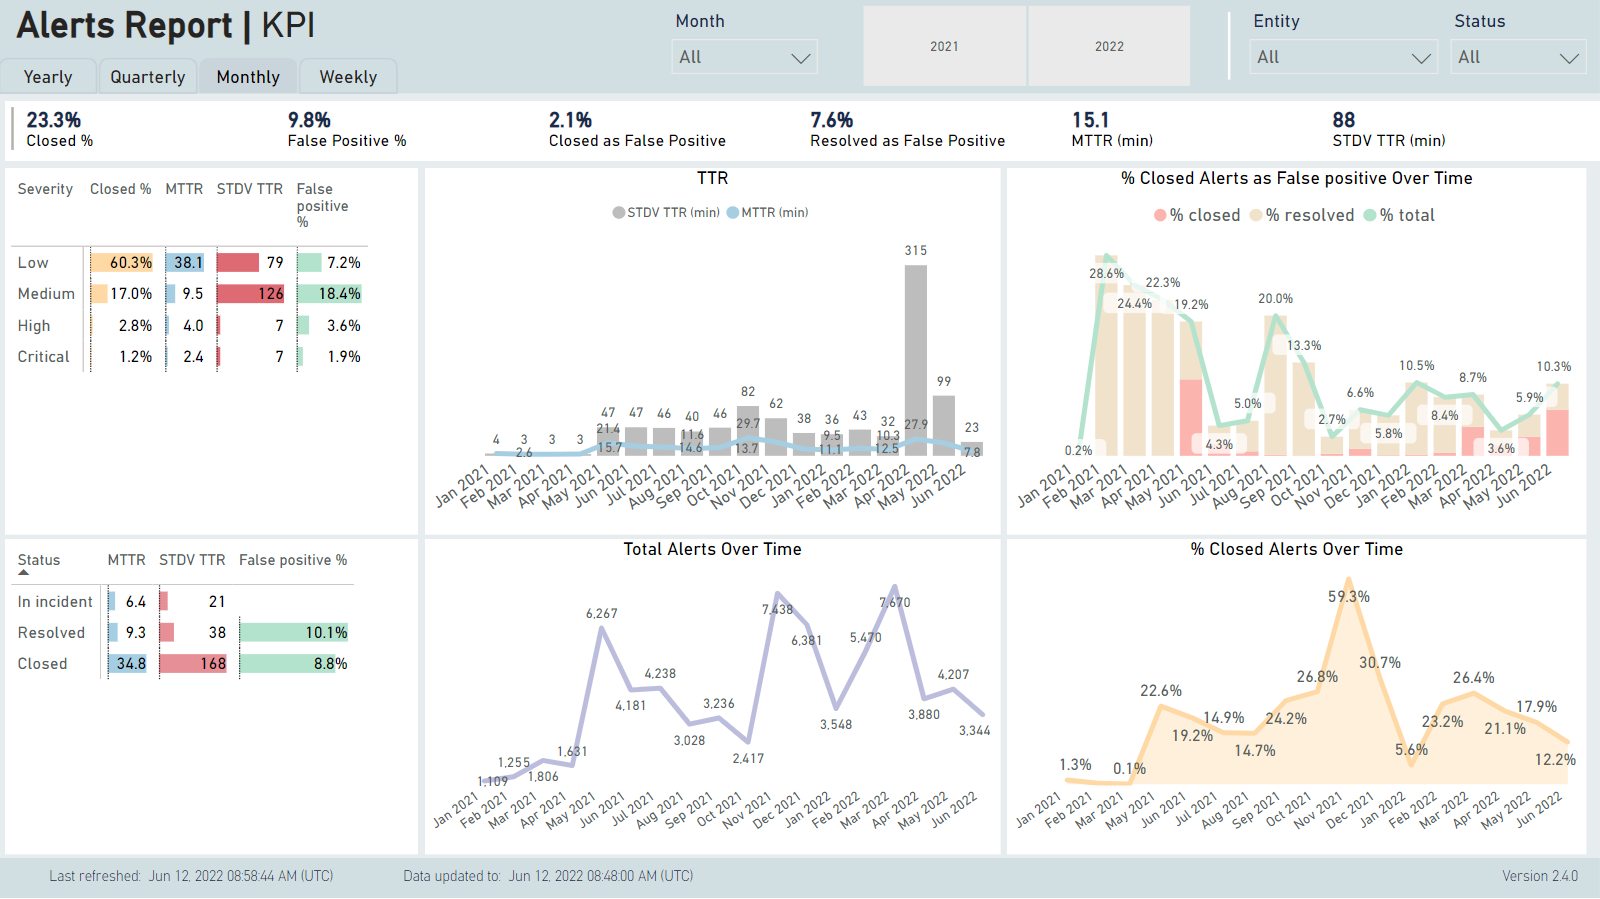
KPI
This tab is intended to give a time-trend overview of key alert-related KPIs:
- Time to Respond (TTR) - measured from alert creation in CDC until the alert is either closed, or attached to an incident. Data will refer to alerts that reach Response during the selected time period.
- False Positive % - the % of alerts closed as False Positive, or attached to an incident that is closed as False Positive. Data will refer to alerts that were closed as False Positive, or attached to an incident that was closed as False Positive, during the selected time period, as a percentage of all alerts closed during the selected period.
- Total alerts - data will refer to alerts that were created during the selected time period.
- Closed % - the percentage of alerts closed without being attached to an incident. Data will refer to alerts that were closed during the selected time period, as a percentage of all alerts closed during the selected period (either as alerts or resolved within incidents).
The Severity and Status graphics are interactive, so you can click on one of the rows, and then all of the graphics and data are updated to show alerts with the selected severity or status only.
Clickthrough to details is supported, and opens the Details tab, with the selections applied to the details table.
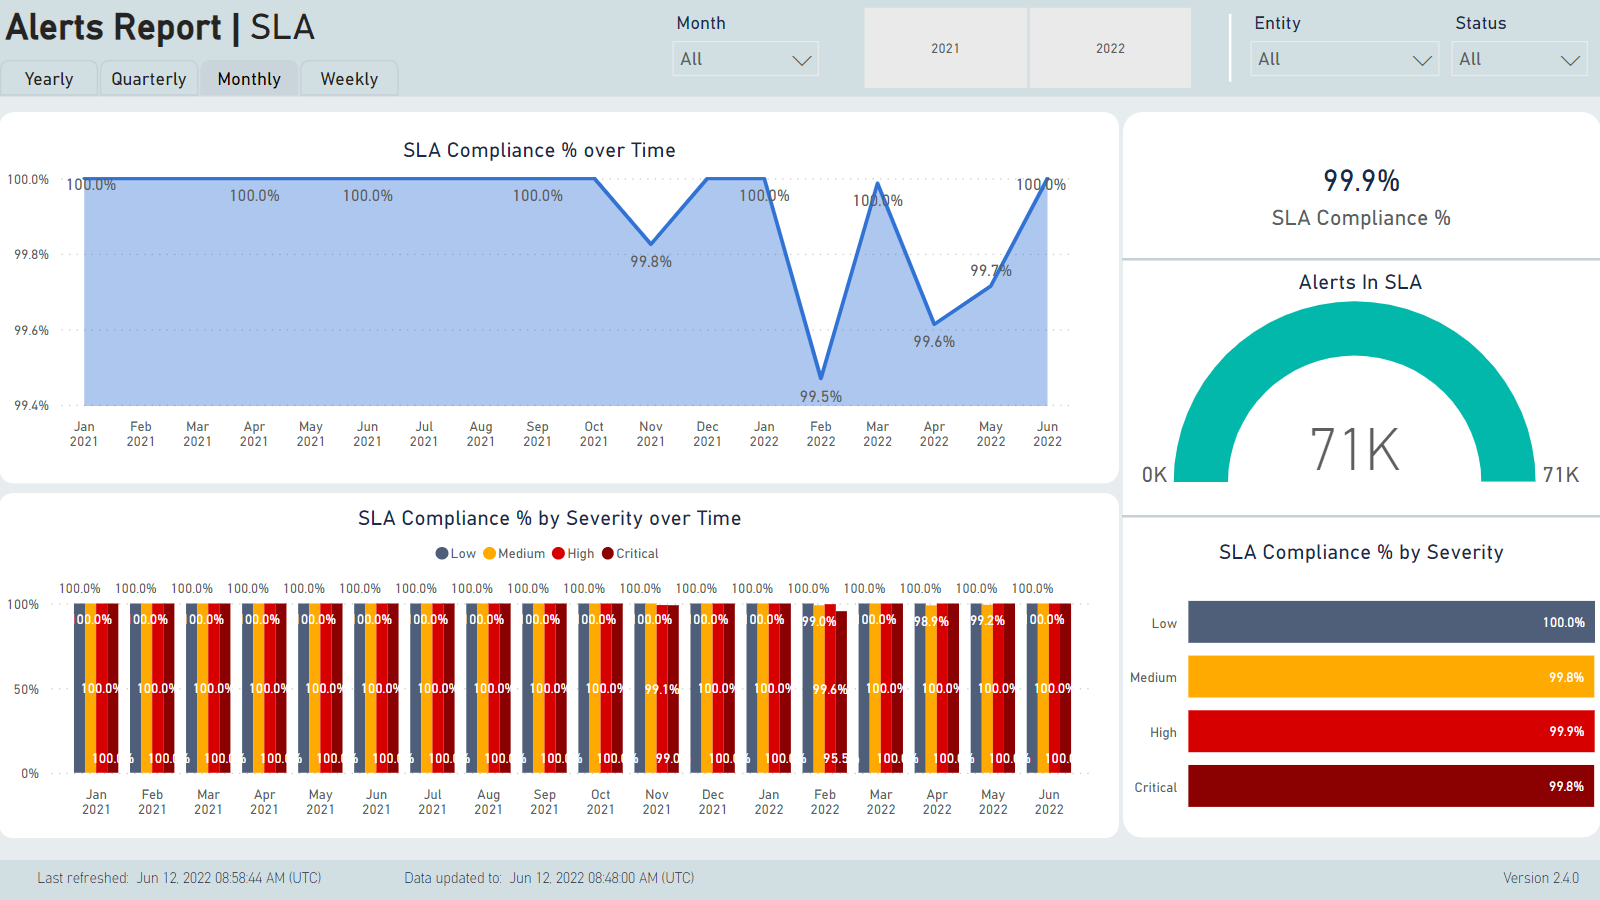
SLA
This tab is intended to give a time-trend overview of key alert-related SLA data. SLA is defined separately for each customer, and defines the maximum allowed time between alert creation in CDC, and its Response (either being closed, or attached to an incident). The maximum time is different for each alert severity level.
This includes:
- A gauge showing how many alerts of the total were triaged within the SLA permitted time.
- A card showing the percentage of alerts that were triaged within the SLA permitted time.
- A bar chart showing the percentage of alerts that were triaged within the SLA permitted time, separated by alert severity.
- A time trend chart showing the percentage of the alerts that were triaged within the SLA permitted time.
- A time trend bar chart showing the percentage of alerts that were triaged within the SLA permitted time, separated by alert severity.
The time filters allow for selecting the months to be included in the report. This will select alerts that reached Response during the selected time period.
There are also combo filters to select alerts by entity or status.
The Severity graphic is interactive, so you can click on one of the rows, and then all of the graphics and data are updated to show alerts with the selected severity.
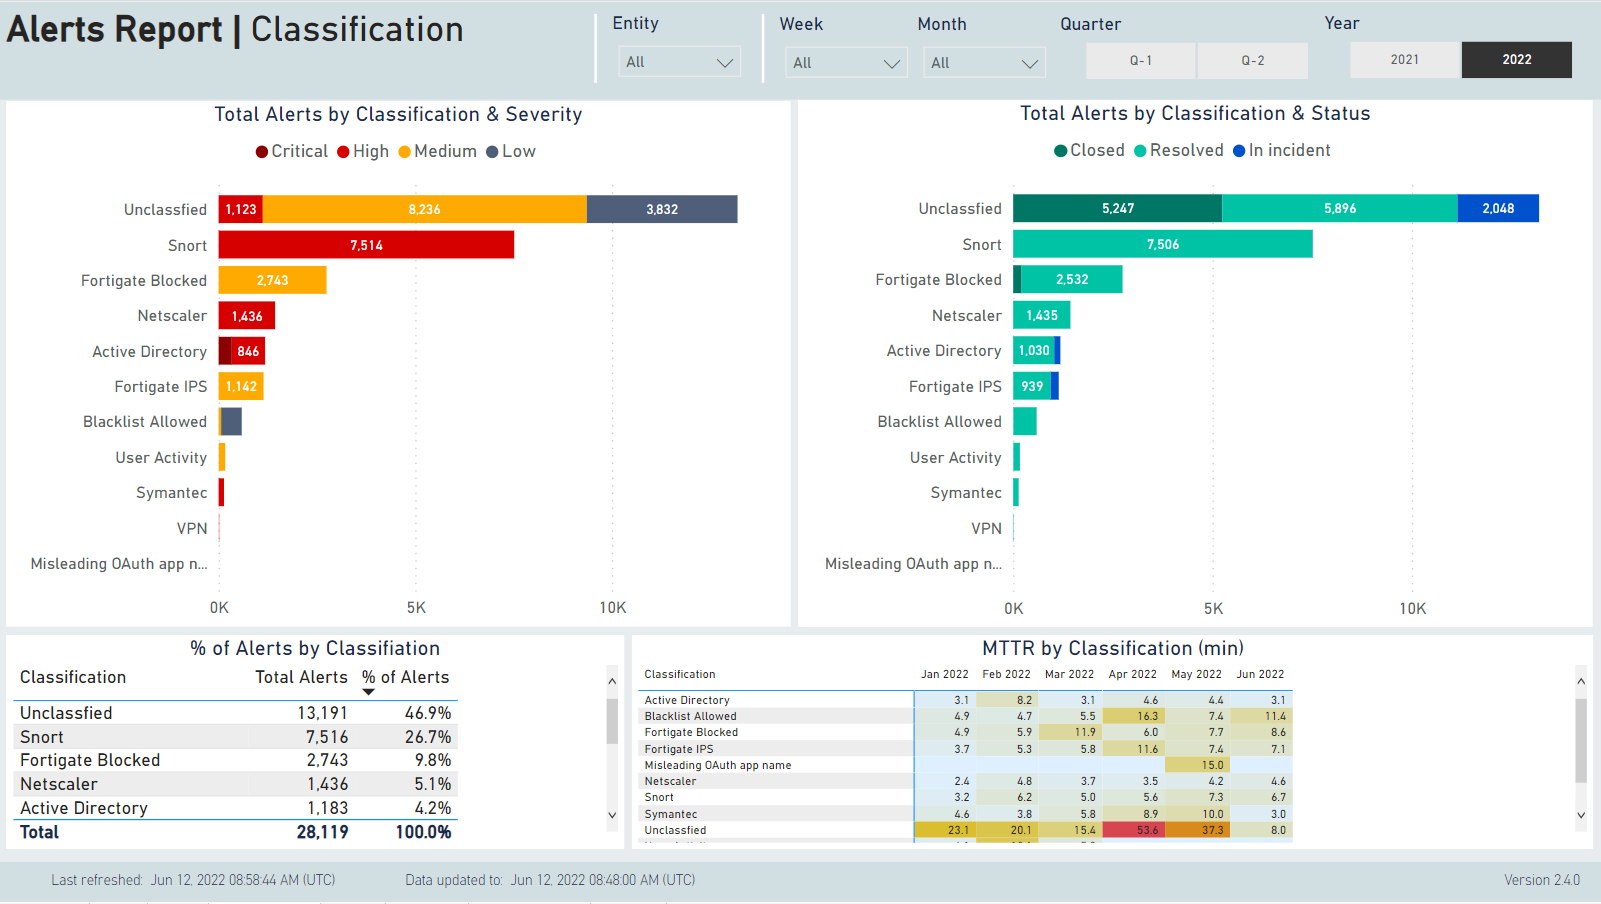
Classification
The Alerts Statistics Classification tab shows statistics built upon the number of alerts in each classification. Alerts can be grouped into classifications, which is useful to get an overall view of the types of attacks the network experiences. Alerts all fall into the 'Unclassified' group unless the CDC is configured to classify them.
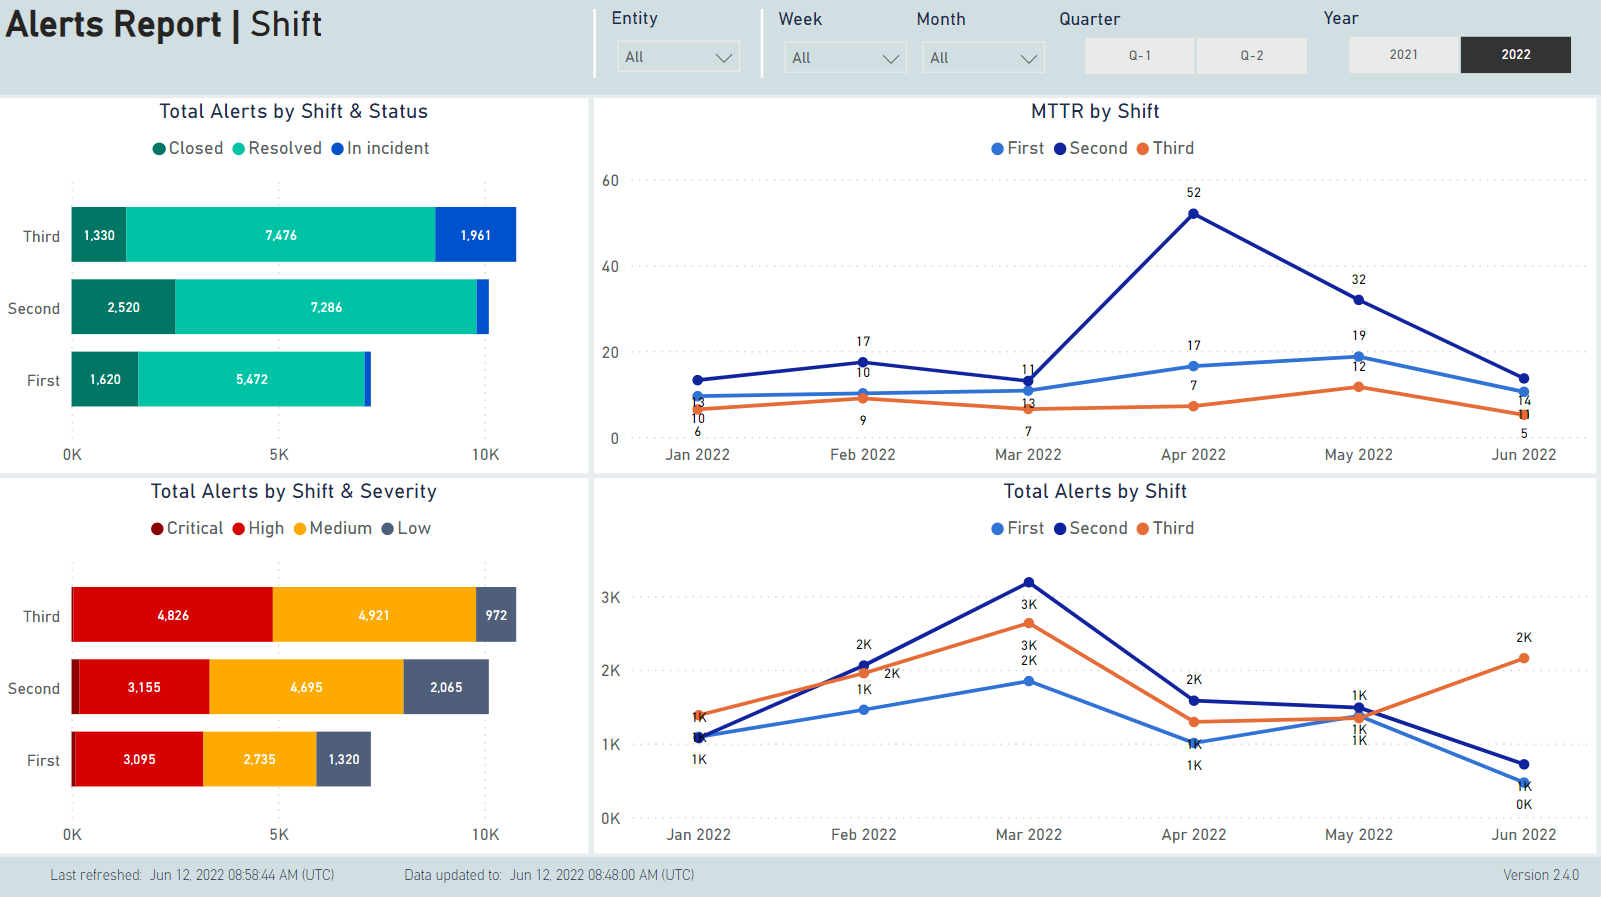
Shift
This tab shows how alerts arrive in the different shifts of the SOC team. It can be very helpful to determine if there is a pattern to the number of alerts; for example if more come during certain times of the day. It also allows for analysis of the typical time to respond to alerts (MTTR) during each shift.
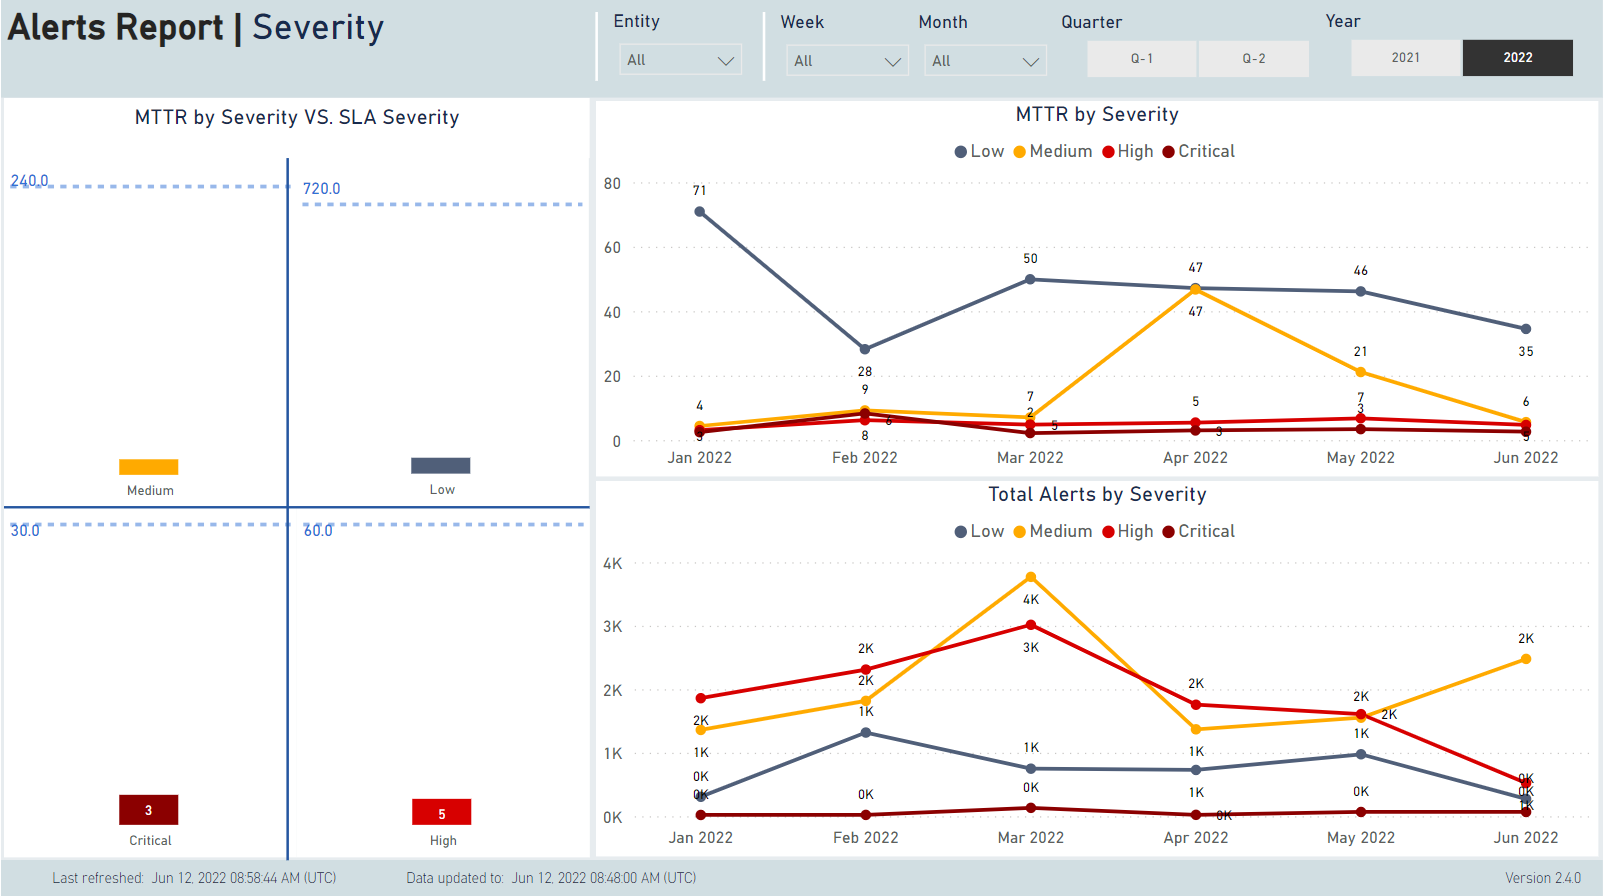
Severity
This tab shows how alerts differ in their severity levels; i.e., how the MTTR is impacted by severity level, how many of each, etc. It also includes a bar graph for each severity level, showing the MTTR for that level, against the SLA for that level, and showing clearly if the MTTR is below or exceeding the SLA. MTTR is measured in minutes.
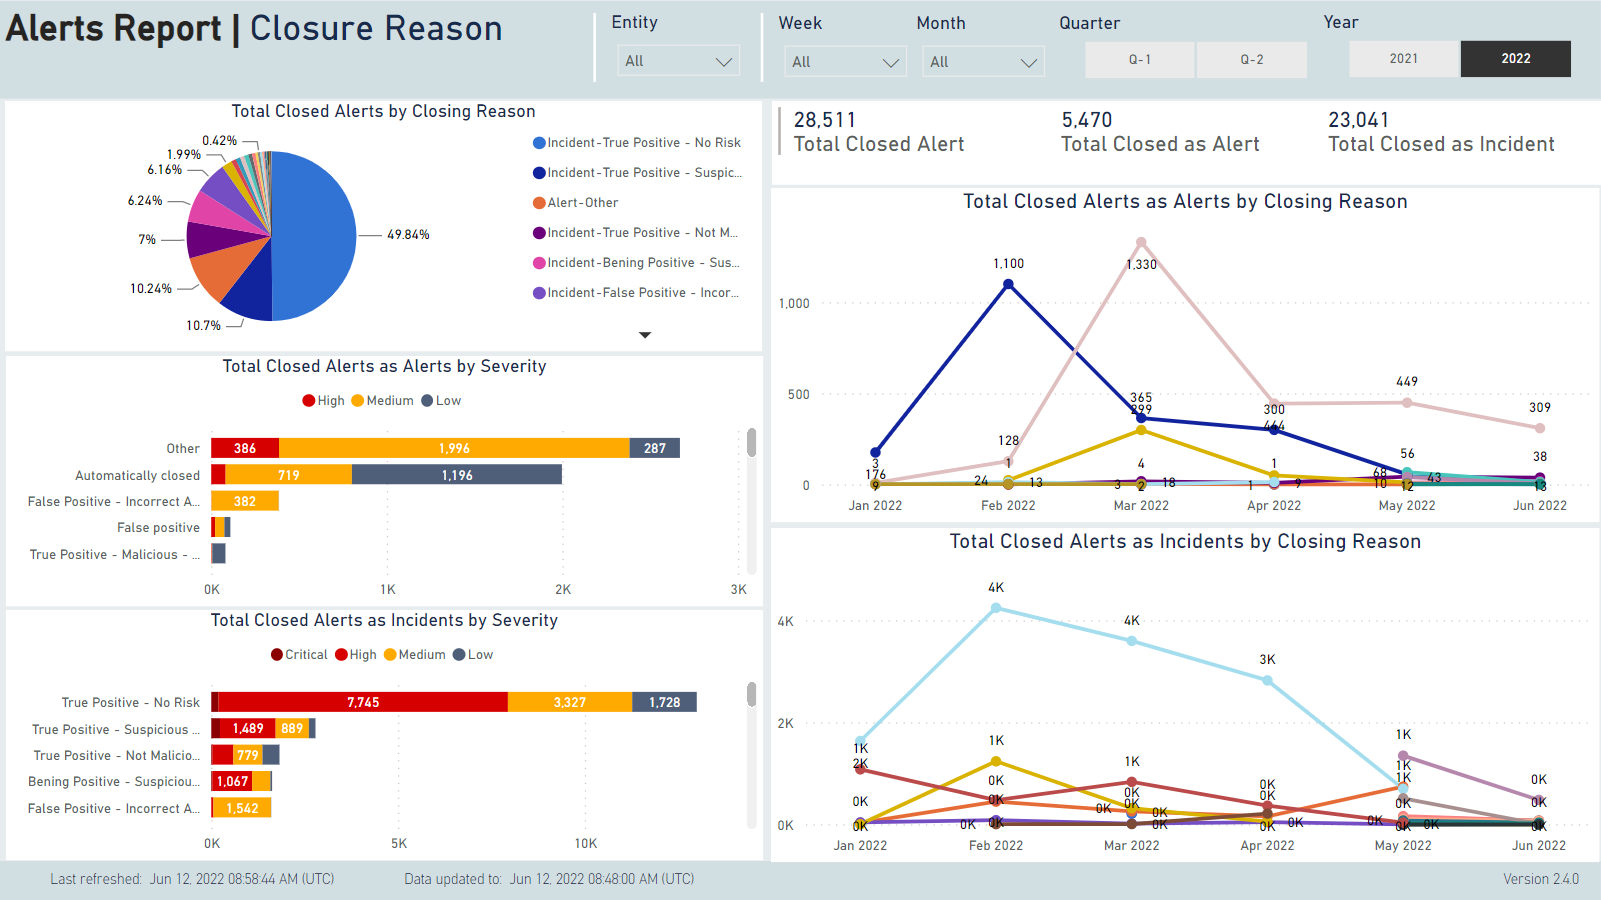
Closure Reason
This tab shows how alerts differ in their closure reasons, how many there are of each, and how these map onto severities.
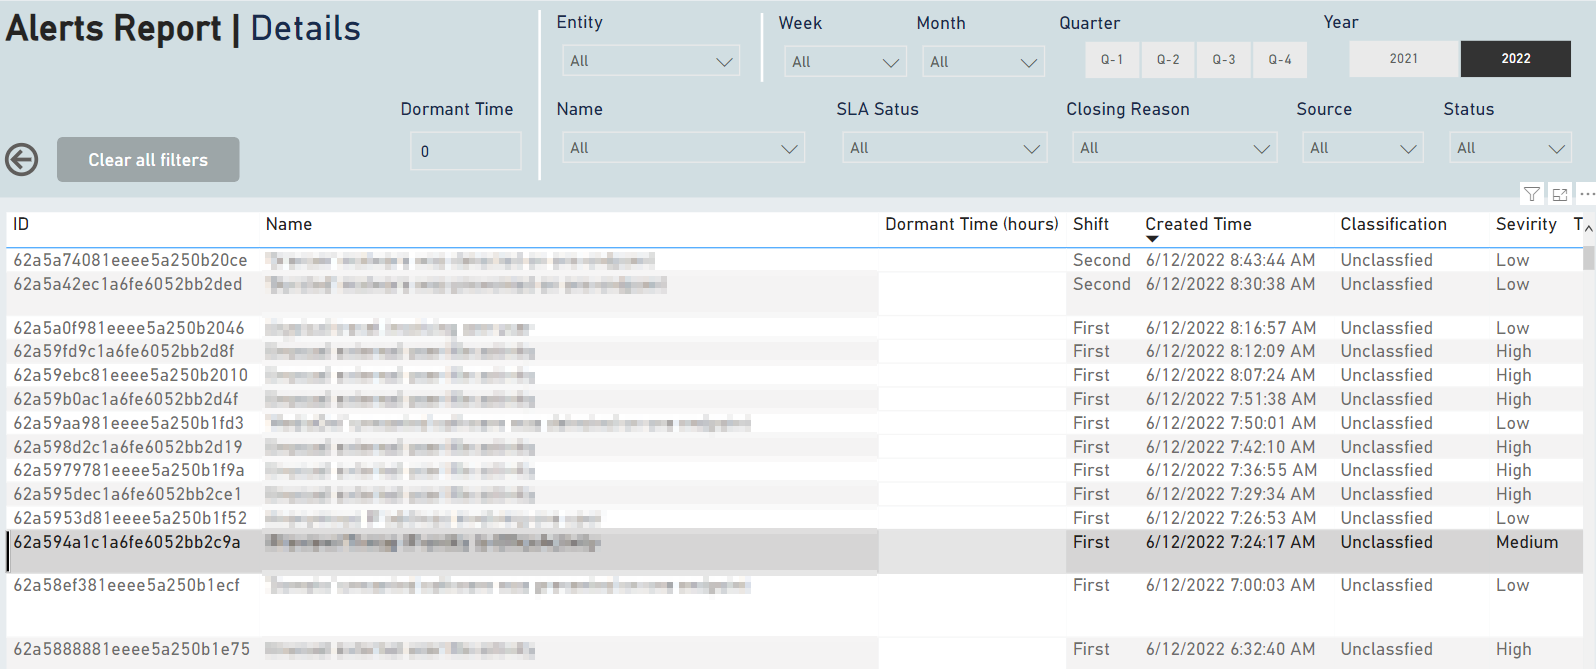
Alerts Details
This tab is a large table with the following data:
- Alert ID (this is the ID by which the alert can be identified within the CDC.)
- Alert Name
- Dormant Time (this is the time the alert has not been touched, if it is still open.)
- Shift
- Created Time (this is the time the alert arrived to the CDC - normally a few seconds after Detected Time.)
- Classification
- Severity
- Time to End Triage (in minutes). This is used to calculate the MTTR data used in the SLA and KPI tabs.
- Owner
- Status
- Closed Time
- Closed By
- In Incident Time (time alert was attached to an incident.)
- Close Reason
- Close Comment
- SLA Status
- Incident Status
- Incident Created Time (this is different from the time the alert was attached to the incident, and refers to the time the incident was created.)
- Time to Resolve (from alert creation until incident closure, in minutes.)
- CDC Incident ID
- Entity
- Source
- External ticket ID (if exists)
- Tags
- Kill Chain
- Link (to open the alert in the CDC.)
Was this article helpful?