SOC Weekly
- 04 Apr 2025
- 1 Minute to read
- DarkLight
- PDF
SOC Weekly
- Updated on 04 Apr 2025
- 1 Minute to read
- DarkLight
- PDF
Article summary
Did you find this summary helpful?
Thank you for your feedback!
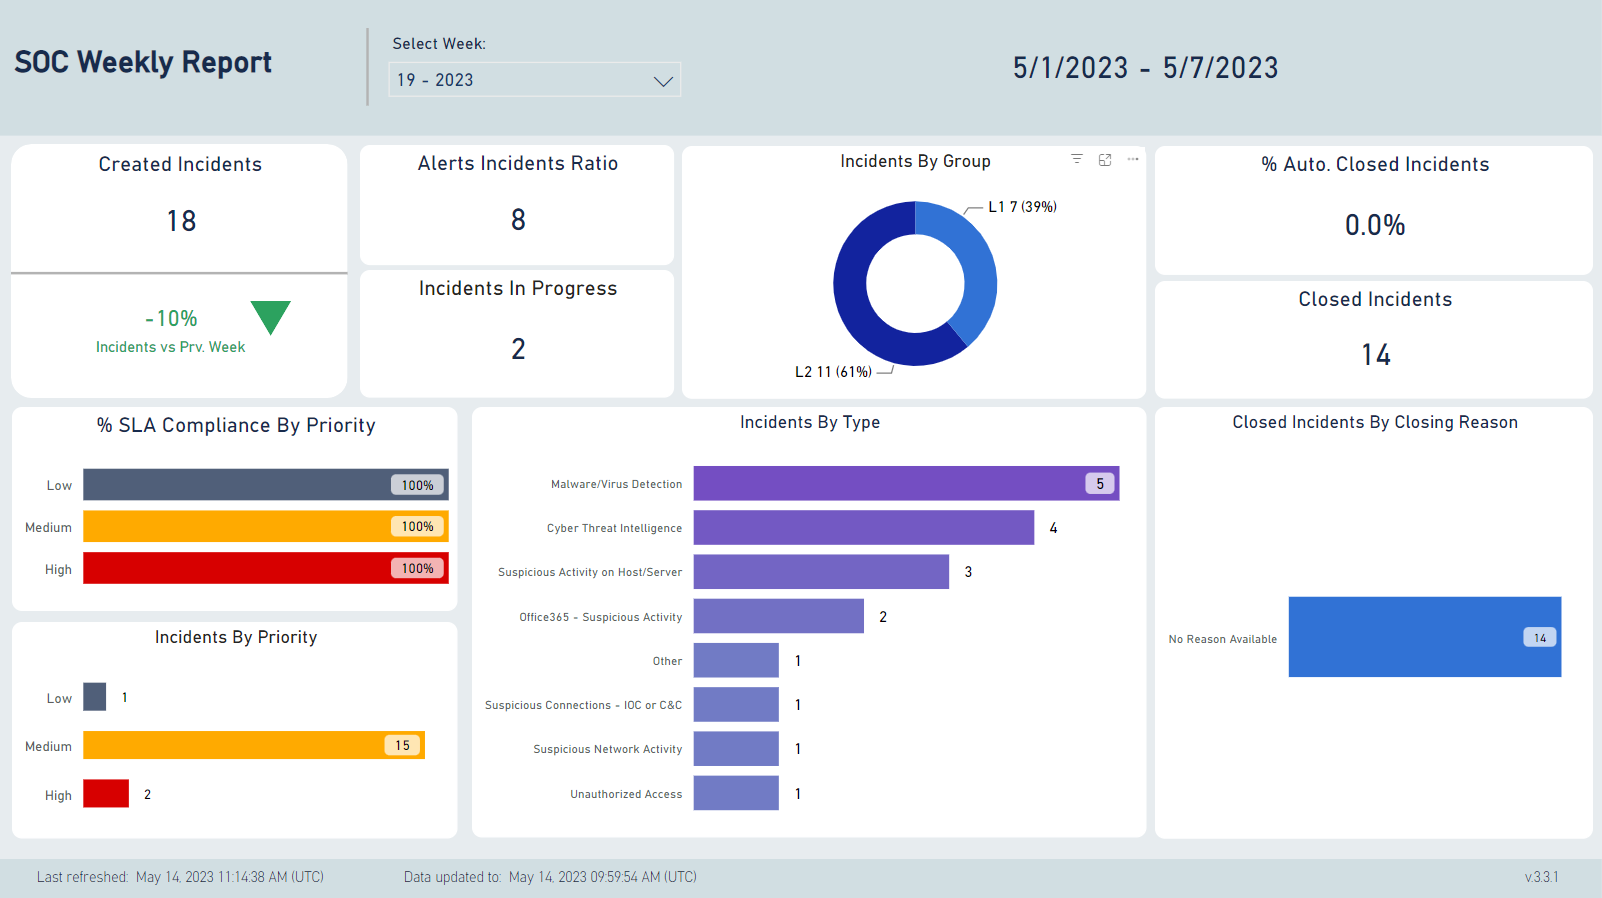
The SOC Weekly report includes a single tab, including the key data SOC teams like to review with customers related to the incidents encountered during the past week. It is available from CDC 3.3 onwards.
There is a filter to select the week whose data should be shown. Note that SOC weeks start on Monday at midnight, and end the following Sunday midnight.
It includes the following information
- Number of incidents created during the selected week
- Change in the number created, compated to the previous week. This is calculated using the following formula: (change in number of incidents)/(previous week's incident count)
- The ratio of alerts to incidents. This is a measure of the effectiveness of the grouping mechanism. Note that this value is not meaningful if any filtering of incidents is applied, based on selections in other graphics.
- Number of incidents currently being processed (in status 'Open' or 'Pending')
- The division of incidents by the group owning them
- The number of incidents automatically closed by an automated playbook
- The number of incidents closed during the week. Note that since a week normally starts with a non-zero number of incidents in progress, this value can sometimes be larger than the number of incidents created during the week.
- Bar chart showing the SLA handling compliance of the incidents, broken down by priority
- Bar chart showing the priority of the created incidents
- Bar chart showing the types of the created incidents
- Bar chart showing the closing reasons of the closed incidents
Was this article helpful?