Incidents KPI
- 29 May 2022
- 2 Minutes to read
- DarkLight
- PDF
Incidents KPI
- Updated on 29 May 2022
- 2 Minutes to read
- DarkLight
- PDF
Article summary
Did you find this summary helpful?
Thank you for your feedback!
This report is intended to give a time-trend overview of key incident-related KPIs:
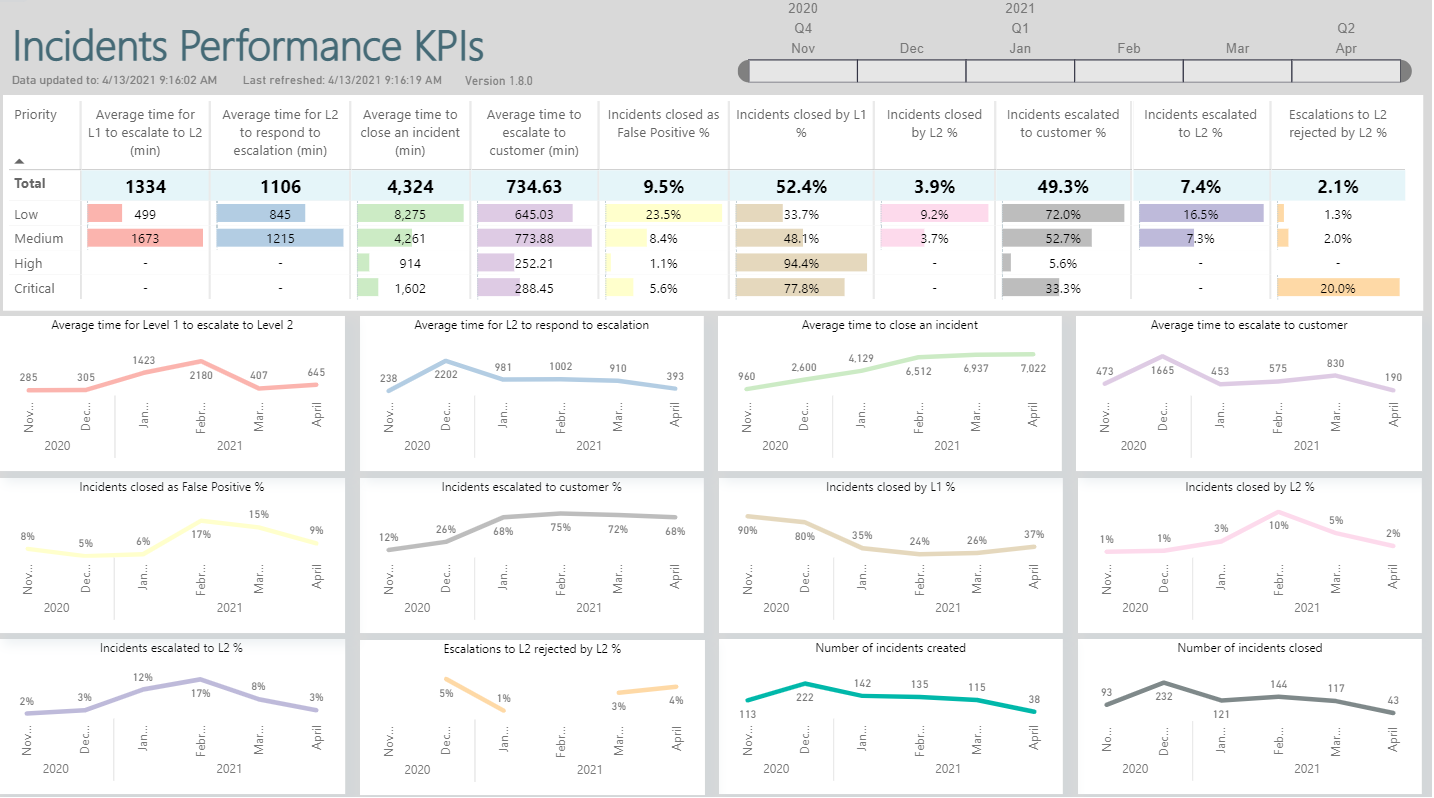
Incidents Performance KPIs
- Average time to close an incident – time from incident creation to final incident closure, for all incidents closed during this time period.
- Average time for Level 1 to escalate an incident to Level 2 – time from incident creation to first incident escalation, for any incidents escalated from L1 to L2 during this time period.
- Average time for Level 2 to respond to escalation from Level 1 – time from L1 escalation until L2 accepts or rejects the escalation, for any incidents escalated from L1 to L2 and accepted or rejected by L2 during this time period.
- Average time to escalate to customer – time from incident creation to incident escalation, for any incidents escalated to customer during this time period.
- Percent of incidents closed as False Positive – incidents resulting in a false positive during this time period, as a % of all incidents closed during this time period.
- Percent of Incidents closed by Level 1 - incidents closed by L1 during this time period for any reason, as a % of all incidents closed during this time period.
- Percent of incidents escalated to Level 2 - incidents escalated to L2 during this time period, as a % of all incidents that were open at L1 at some time during this time period.
- Percent of incidents escalated to Customer - incidents escalated to Customer during this time period as a % of all incidents that were open at some time during this time period.
- Percent of escalations to Level 2 rejected by L2 - for any incidents escalated to L2 and rejected by L2 during this time period, as a % of all incidents escalated to L2 and rejected or accepted during this time period.
- Percent of incidents closed by Level 2 - incidents closed by L2 during this time period for any reason, as a % of all incidents closed during this time period.
- Number of incidents created during the time period.
- Number of incidents closed during the time period.
The time filters allow for selecting the months to be included in the report. This will impact different graphic and data elements differently - as detailed above. All of the KPIs relate to when the relevant event occurs to the incident, irrespective of when the incident was opened.
v1.8 supports monthly granularity selection only - future versions will include finer granularity options.
The Priority graphics are interactive, so you can click on one of the rows, and then all of the graphics and data are updated to show incidents with the selected priority only.
The report includes a time stamp of the most recent data point included in the report ('Data updated to), and a time stamp of when the graphics in the report were last refreshed ('Last refreshed'). Both of these time stamps are in UTC.
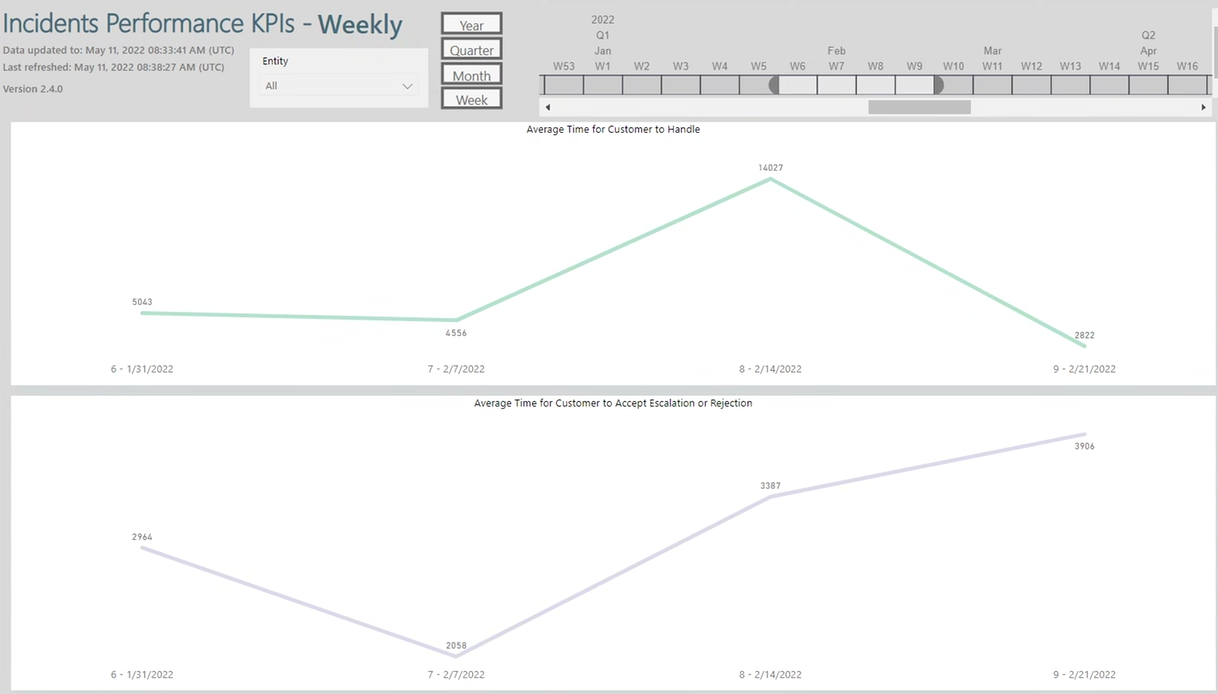
Customer Performance KPIs
This report is intended to show how the customer has handled the incidents
- Average time for customer to handle - average time that the incident has been open on the customer. In cases where the incident moves more than once to and from the customer, this counts only the time it is open on the customer
- Average time for customer to accept or reject escalation
Known Issues: None
Was this article helpful?