Alerts Summary
- 04 Apr 2025
- 1 Minute to read
- DarkLight
- PDF
Alerts Summary
- Updated on 04 Apr 2025
- 1 Minute to read
- DarkLight
- PDF
Article summary
Did you find this summary helpful?
Thank you for your feedback!
Alerts Summary
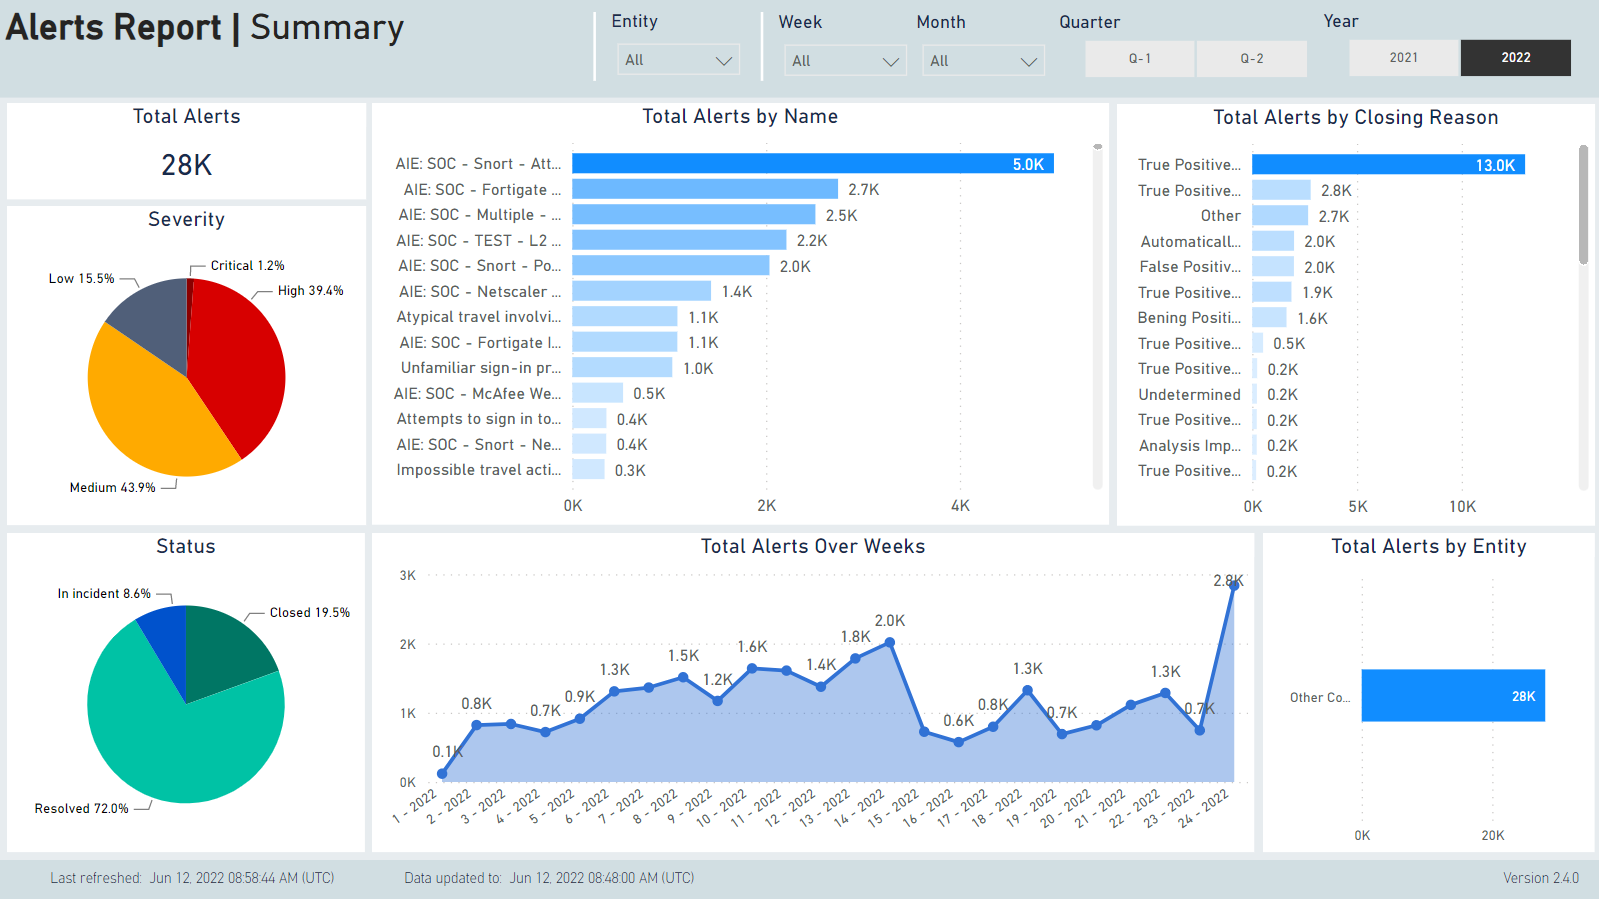
This is the first tab in the Alerts Report. This tab is intended to give a high level overview of the Alerts, viewed in multiple ways:
- Total number of alerts
- Number in each status (New/In Incident/Closed) - Closed means it was closed as an alert without being attached to an incident.
- Total by closure reason
- Number by use name
- Number by severity
- Number per week
- Number per entity (some customers have different companies managed within a single CDC, and alerts can be tagged with this information)
The time filters allow for filtering alerts based on their creation date. The graphics are interactive, so you can click on the Severity pie chart, for example, and then all of the graphics and data are updated to show alerts with the selected severity only.
Clickthrough to details is supported, and opens the Alerts Details tab, with the selections applied to the details table.
The report includes a time stamp of the most recent data point included in the report ('Data updated to ), and a time stamp of when the graphics in the report were last refreshed ('Last refreshed'). Both of these time stamps are in UTC.
Was this article helpful?