- 04 Apr 2025
- 1 Minute to read
- DarkLight
- PDF
Alerts KPI
- Updated on 04 Apr 2025
- 1 Minute to read
- DarkLight
- PDF
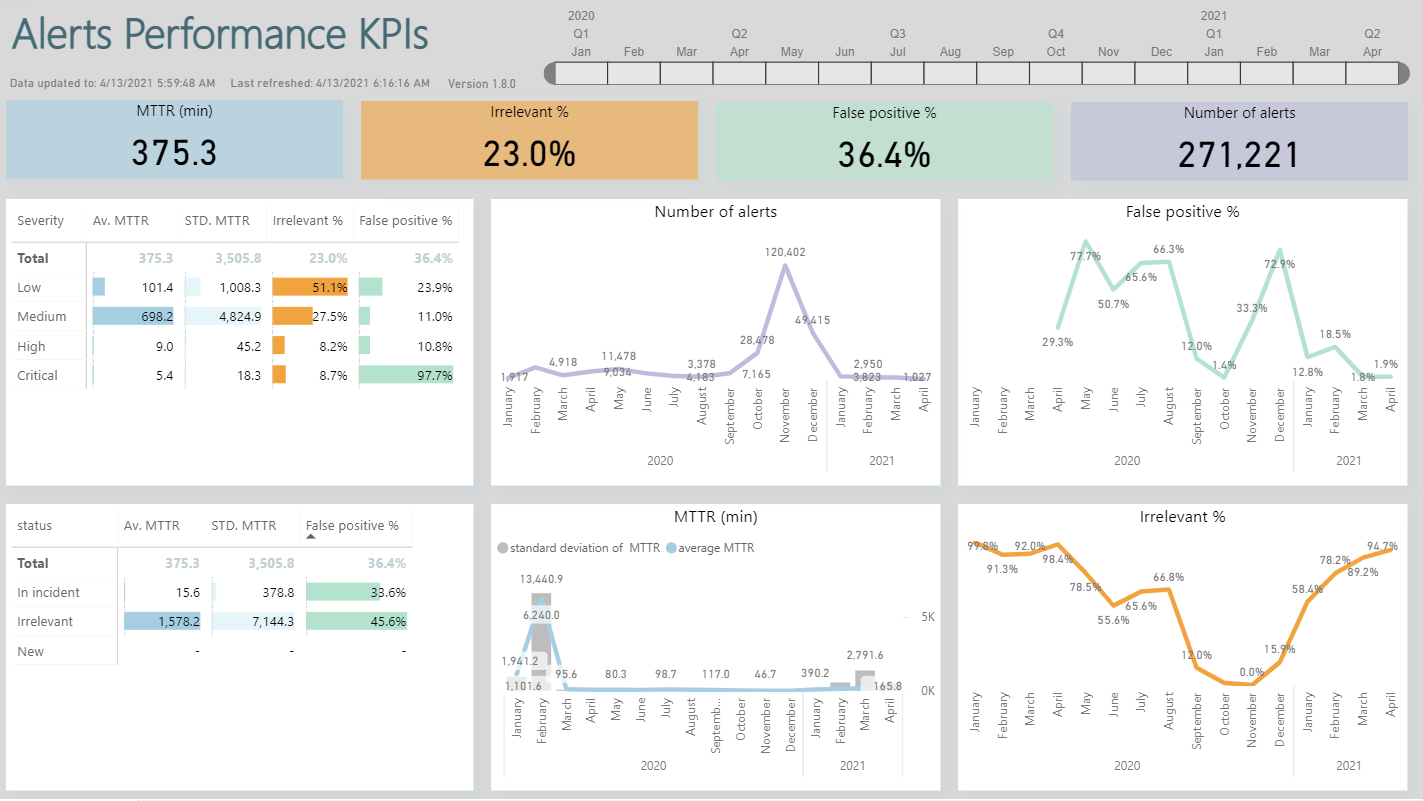
This report is intended to give a time-trend overview of key alert-related KPIs:
- Mean Time to Respose (MTTR) - measured from alert creation in CDC until the alert is either closed, or attached to an incident. Data will refer to alerts that reach Response during the selected time period.
- Irrelevant % - the % of alerts closed without being attached to an incident. Data will refer to alerts that were closed as irrelevant during the selected time period, as a % of all alerts closed during the selected period.
- False Positive % - the % of alerts closed as False Positive, or attached to an incident that is closed as False Positive. Data will refer to alerts that were closed as False Positive, or attached to an incident that was closed as False Positive, during the selected time period, as a % of all alerts closed during the selected period.
- Number of alerts. Data will refer to alerts that were created during the selected time period.
The time filters allow for selecting the months to be included in the report. This will impact different graphic and data elements differently - as detailed above.
v1.8 supports monthly granularity selection only; future versions will include finer granularity options.
The Severity and Status graphics are interactive, so you can click on one of the rows, and then all of the graphics and data is updated to show alerts with the selected severity or status only.
The report includes a time stamp of the most recent data point included in the report ('Data updated to ), and a time stamp of when the graphics in the report were last refreshed ('Last refreshed'). Both of these time stamps are in UTC.

Known Issues in v1.8:
None

