Alert Handling
- 02 Apr 2025
- 12 Minutes to read
- DarkLight
- PDF
Alert Handling
- Updated on 02 Apr 2025
- 12 Minutes to read
- DarkLight
- PDF
Article summary
Did you find this summary helpful?
Thank you for your feedback!
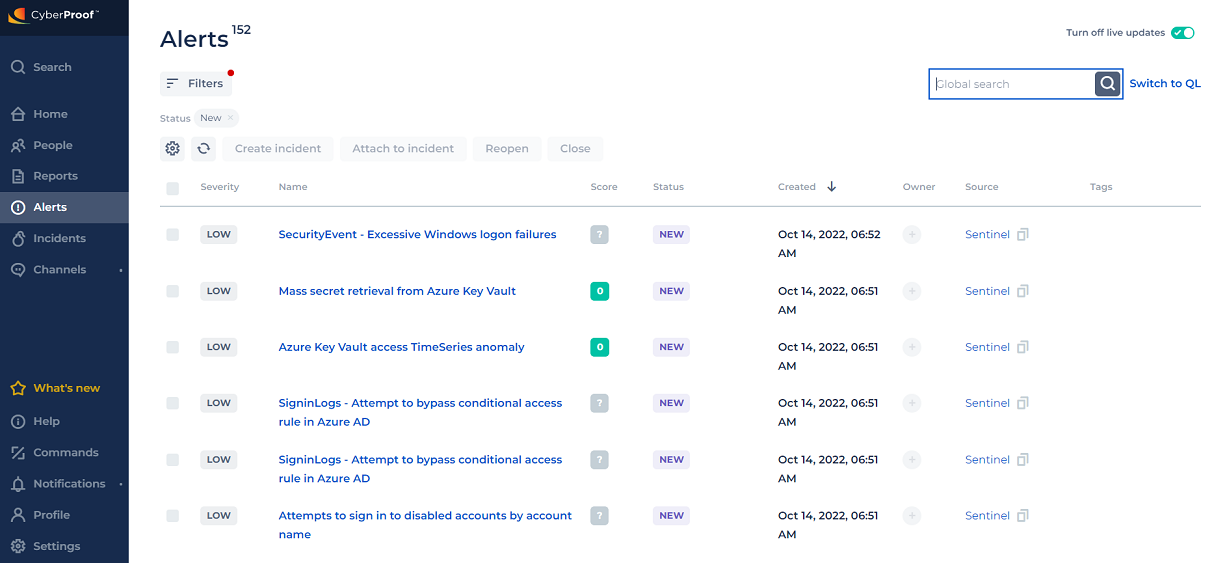
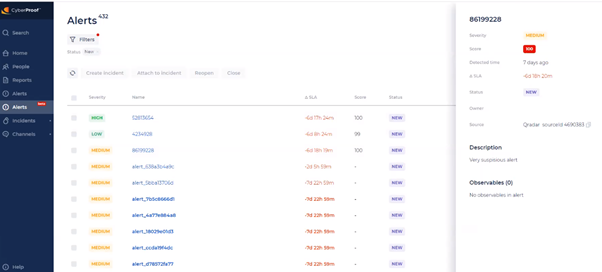
Alert Dashboard
The Alert dashboard includes a detailed list of alerts channeled into the CDC from the organizational Security Information and Event Management (SIEM) tool - including all of the organization’s security products, log analysis from the network, firewalls, endpoint traffic, etc. Each alert includes a number of different fields describing the alert. You can sort and filter all fields except SLA.
Tip: Use the severity and SLA indicators to prioritize alert handling.
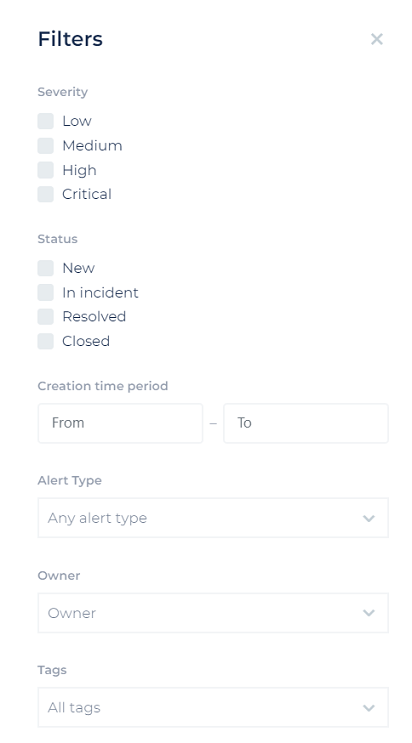
Filters
In the Alert dashboard, you can perform various functions using filters, including:
* Filtering the table by any column title - or sorting by ascending/descending - by clicking the column field names.
* Clicking Filters at the top of the screen, to open a small context-sensitive window that provides pre-defined field options or enables you to enter free text. You can select the severity and status of the filter, filter the status by owner, and more.
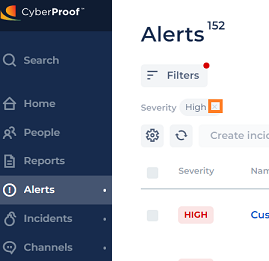
* Opening each filter window individually to clear alert filtering contents.
* Close existing filters by clicking the small x next to any filters you've added.
- Having your filters saved even after you refresh (F5) the page or log out of the platform. You will not have to select them each time from the beginning.
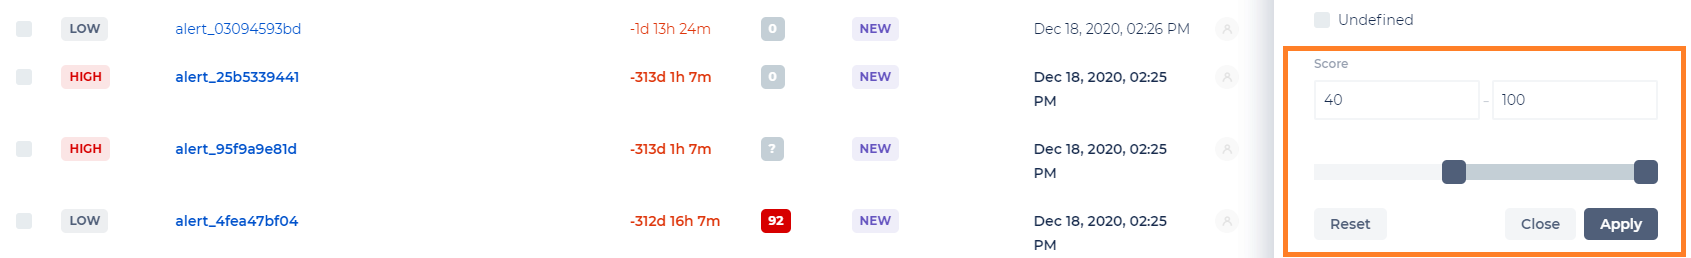
- Filter alerts by score value.
- Copy and paste the detection time and date, both in the "From" and "TO" fields. To copy, click CTRL+A and CTRL+C. To paste, click CTRL+A and CTRL+V.
Dashboard Options
In the Alert dashboard, you can:
- Refresh the Alert table so that the table is always updated with the newest alerts and updates the SLA countdown as well.
- Get live updates on alerts, by clicking the Live updates toggle button at the top right of the screen (Live Updates are turned on by default). Note that when this feature is turned off, the Alerts list will not update when changes are made, and you will need to manually refresh the page to update your alerts.

- Preview alert details by clicking anywhere on the alert (except on the alert name). This will open a preview window that offers important alert details and allows for quick and easy browsing between alerts. This capability can help you decide whether to take further action or know whether this is a false positive alert.
- Search alerts by all text fields that appear in the Alerts and Incidents grids.
- Take ownership of handling the alert.
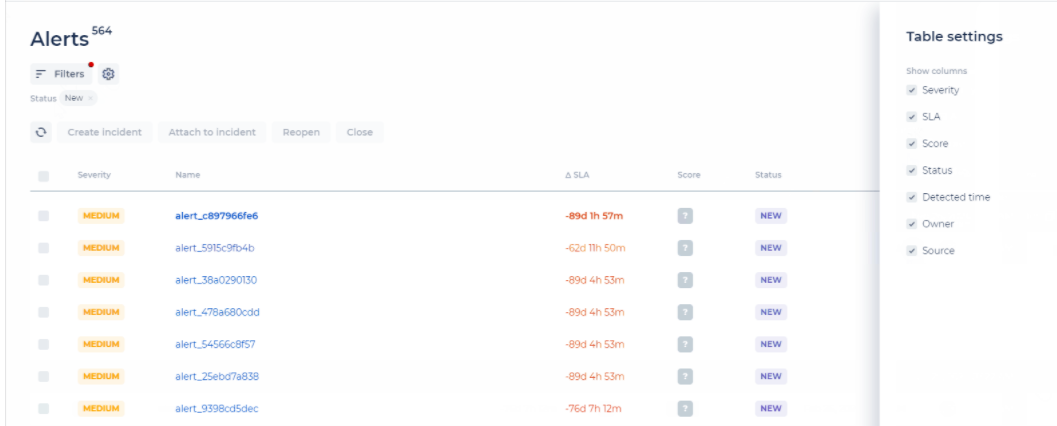
Select which columns will be presented in the Alert and Incident grids. You can customize these as needed by clicking the Settings icon and then selecting the columns you want to present via the Table Settings.
Open alerts in a new tab.
Alert Field Descriptions
Click on an alert row to view its observables, raw data, and other details. See the Alert Details section below for additional information.
| Field Name | Field Description | Field Range/Units |
|---|---|---|
| Severity | The alert severity is denoted with a colored arrow. Click on the field name to sort alerts by severity. Critical is the highest severity and will show the least amount of time to handle the Alert. Low is the lowest severity, which usually offers the most time to handle an alert. The handling times are defined per organizational SLA definitions. | Low, Medium, High, Critical |
| SLA | Service Level Agreement – Countdown Time - Lists how much time is left to handle the alert. The initial time period is defined as per the company’s SLA. | Days/Hours/Minutes |
| Score | Lists the calculated alert score based on different alert observables such as IP, URL, domain, file, server, host, etc. | 0-100, Where: 0 is not severe, 100 is most severe |
| Status | Defines the alert status. Closed alerts do not require mitigation but are important to detect so as to improve automatic detection algorithms. They arise from: False Positives: Alerts that were incorrectly triggered; or Alerts triggered from detected approved actions within the organization. For example: a user was approved to be added to a privileged user group. | New: This is a new alert. In Incident: The alert is included in a current incident. See Incidents dashboard or incidents report. Closed: The alert is irrelevant and closed. Note: For false positive alerts, add a comment as to why alert occurred. Resolved: The incident was closed. |
| Detected Time | Lists the time when the alert was detected. | Format: Mon dd, yyyy hh:mm AM/PM |
| Name | Lists the name of the alert as received from the various channel sources. The source is listed in the Source column. | Pre-defined alert names. |
| Owner | Lists the alert owner. You can take ownership of the alert or remove yourself from ownership of the alert. Place your cursor on the small colored circle to view the owner’s name/email. Only you can take ownership of the alert or remove yourself from ownership of the alert. You cannot assign ownership to someone else. | Take ownership of this alert by clicking a Take Ownership icon that appears only when hovering your cursor over the Owner column in the row for the selected Alert. The action is updated with a success message. Remove yourself from owning this alert by clicking the Delete icon next to the owner’s avatar circle, |
| Source | This is the source from where the alert originated. | Source Name |
| Observables Tags | Contains all tags from all related observables. | Observables Tags |
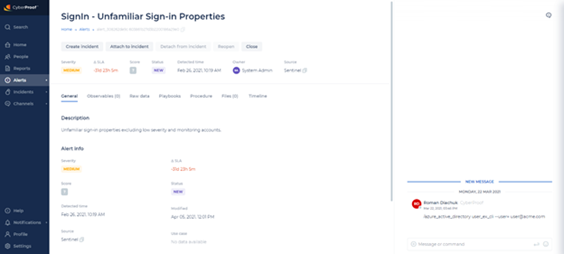
Alert Details
The Alert Details view enables you to click the alert name on an alert row to open information about that alert. This gives you an initial idea of what happened to cause the alert and other details such as its vulnerability, and how the alert can possibly be mitigated.
In the Alert Details view, you can create an incident from one or more alerts, attach or detach alerts to an incident, see the alert’s raw data or playbooks, add comments, and see any observables that exist for that alert. You can also tag an alert with relevant information (e.g., Ransomware), or set the kill chain phases related to the alert.
Additionally, when an alert is fetched, the rule name is stored as part of the alerts data in the CDC. This can be seen in the Detection Rule field. Note that one rule can generate many alerts, but for a single alert, there can only one rule. Note also that this feature is supported in the CDC API, but not in the UI.
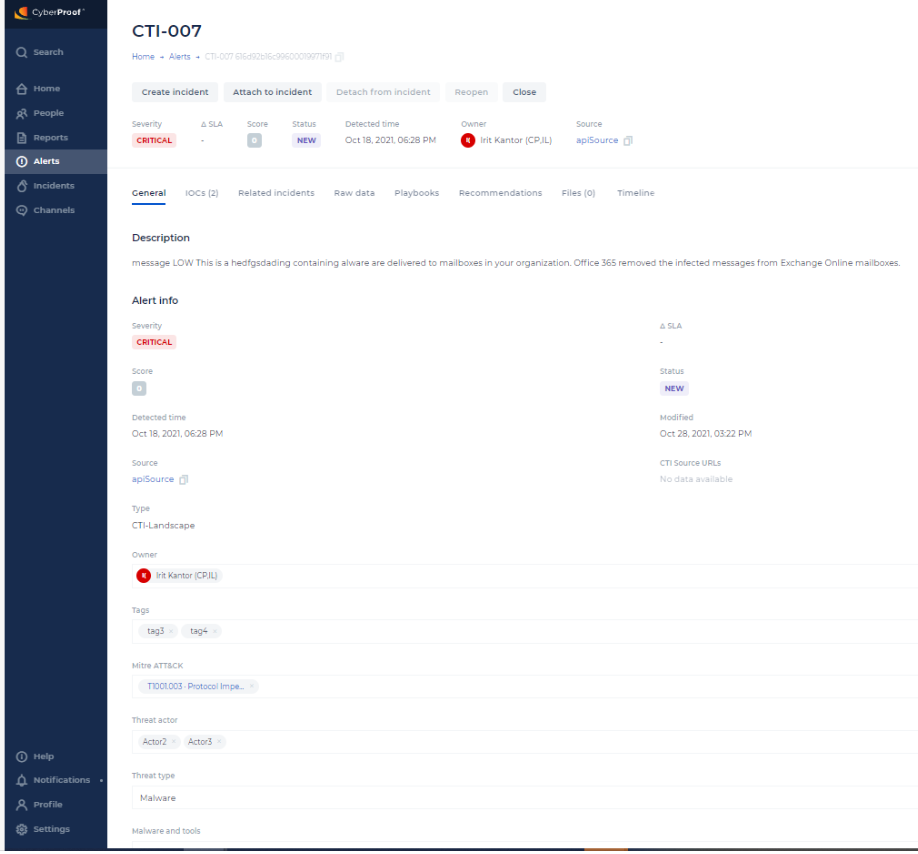
Threat Intelligence Alerts
Threats can be reported and managed directly in the CDC platform, through Threat Connect.
With this capability, an L1/L2 persona can handle threat intelligence cases, as well as alerts from other sources. Using the CDC platform enables the Threat Intelligence team to gather and analyze cases using previous alert information. Here you have a view of CTI events and can see the benefits of threat prevention on your system. This capability additionally enables you to see a history of what happened for each alert.
Query Engine Visualization
You can get visualization results from the query engine and present it near the result, with the ability to define in the query framework how you want to view the data. This helps you view data from queries in a visual way, for more improved understanding.
You can also download the graph file.
The video below illustrates viewing the results using the table and graph views.
Alert Details Tabs
The Alert Details view consists of several tabs/sections, which are described below.
General
In the General tab, you can view a description of the alert, and additional Information such as the severity, status, and detected time of the alert.
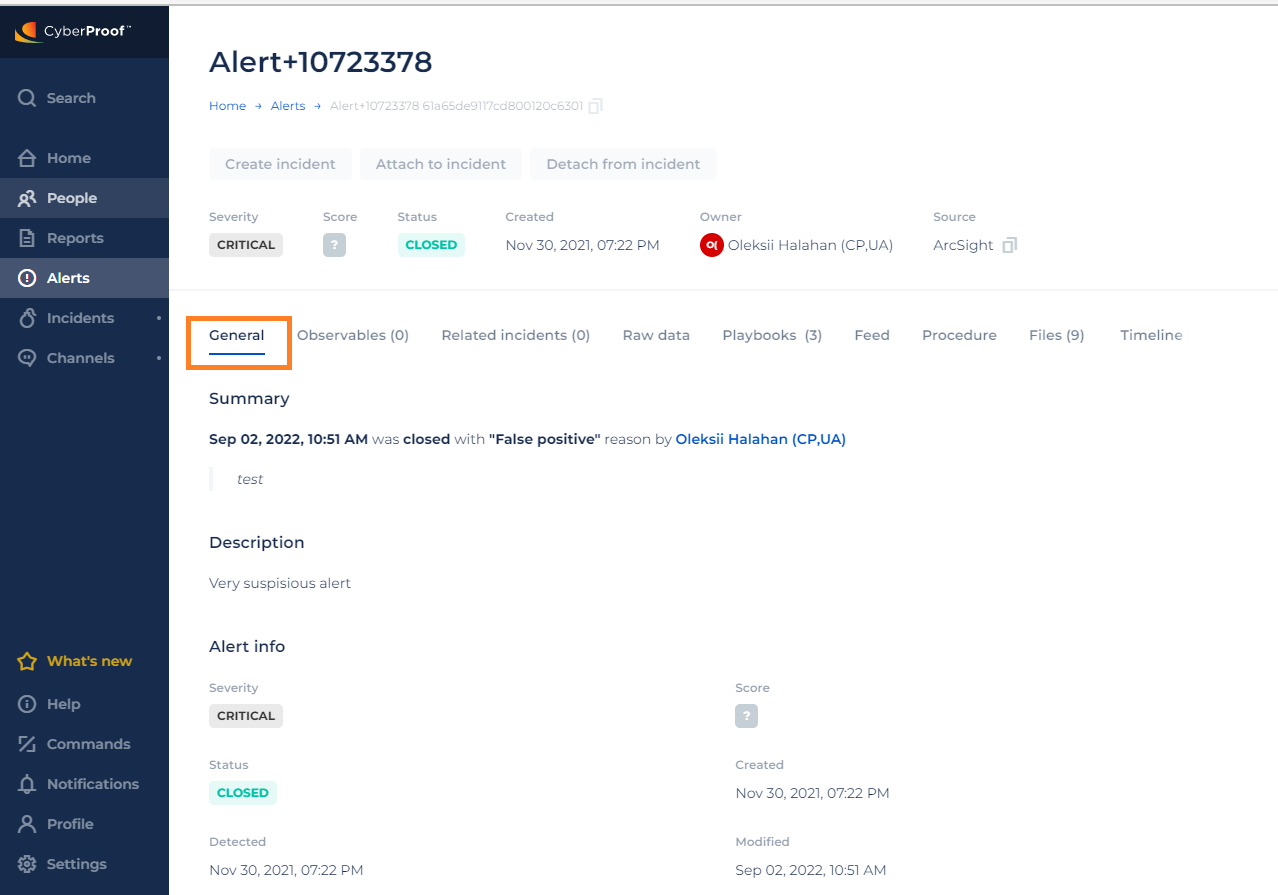
You can also group alerts and incidents into categories, to enable better understanding of the types of alerts and incidents arriving in the platform. This is useful for automations that are triggered based upon the categorization of an alert. As an alert is created, it is automatically categorized, with the Classification field in the alert populated. The classification field is presented in the General tab. Historical alerts contain an Unclassified value, as this is a mandatory field.
Observables
In the Observables tab, you can view any available observables for the alert. Observables provide additional information and context that can help you determine how to handle the alert.
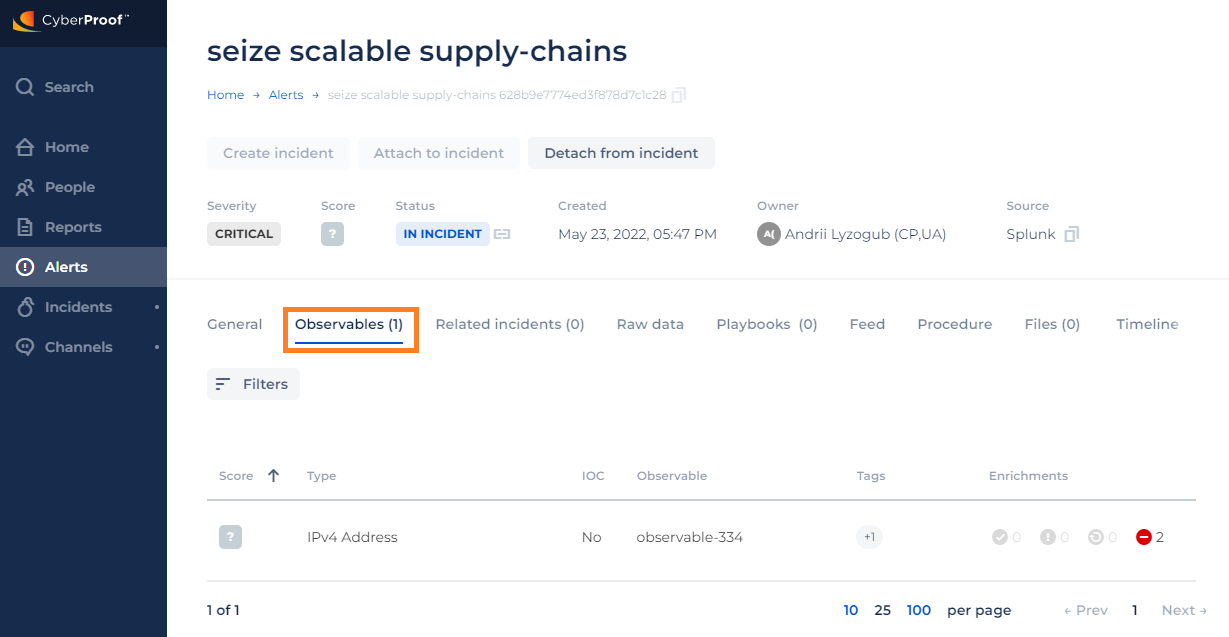
Observables are comprised of the evidence elements already collected about an alert. They may help indicate why the alert occurred and may also help decide whether to take further action or whether this is a false positive alert.
Observables include detailed information about the alerts and incidents. They are listed with Type and Tags helping to define them along with the number of Suspicious observables.
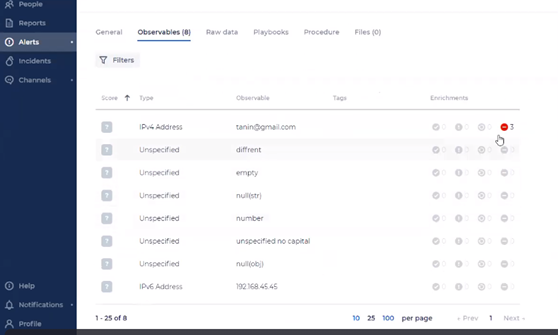
New observable types are added automatically to the Observables list. When the platform recognizes a new type that is not yet defined in the Observables type list, the type will be added automatically to the list.
Within Observables, you can also view an observable's score, which is calculated by using the weight of each enrichment and the score that it gets from it. This includes the ability to see a formula of how the observable score was calculated.
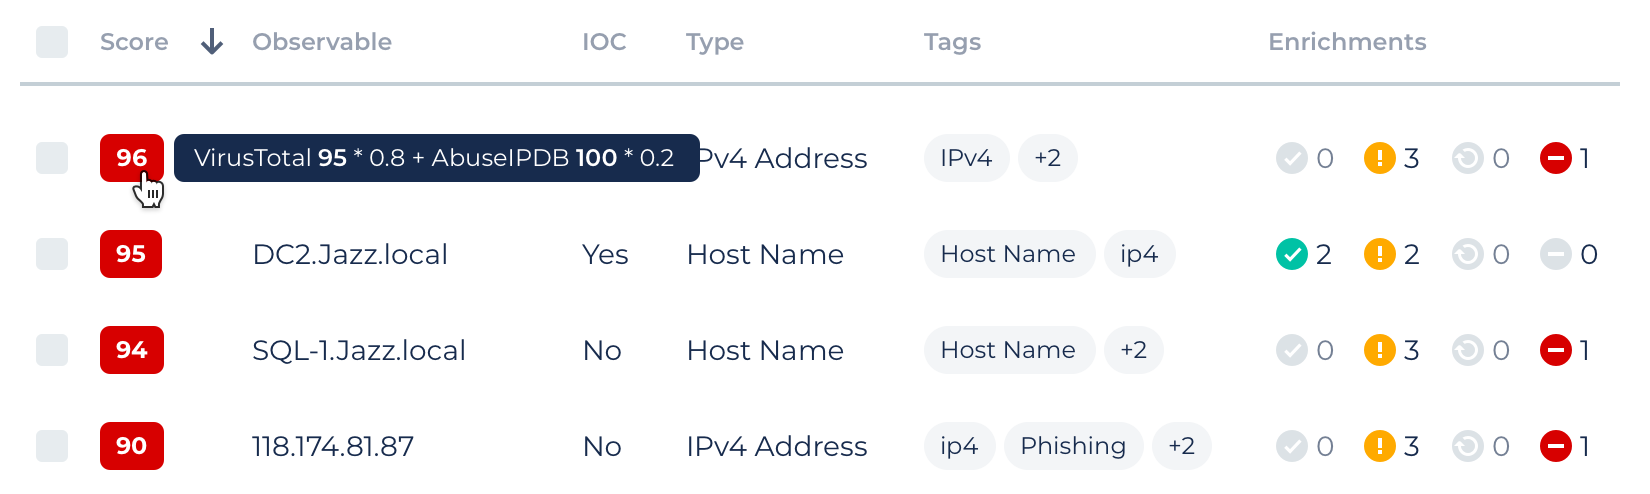
Observables come in many forms, such as IP, URL, domain, file, server, host, etc. SeeMo also investigates the Observable item via the web and other sources, and calculates a Suspicious rate based on its results. Suspicious or non-suspicious observables can be displayed or hidden. Observables can be sorted in ascending or descending order according to various characteristics.
The Tag window offers already existing tag names to choose from and also has two icons that indicate whether other alerts or Incidents are tagged identically. This will help you identify similar trend events.
Note: For enrichments that are stuck, you can re-run them for each observable on demand. For each enrichment source, the platform supports a different timeout (the timeout is configurable). When exciding the timeout, the status is set to "Failed".
Note: You can filter observables using a multiple type selection. This provides more accurate information and increases observables' visibility. You can also add/remove values from this field.
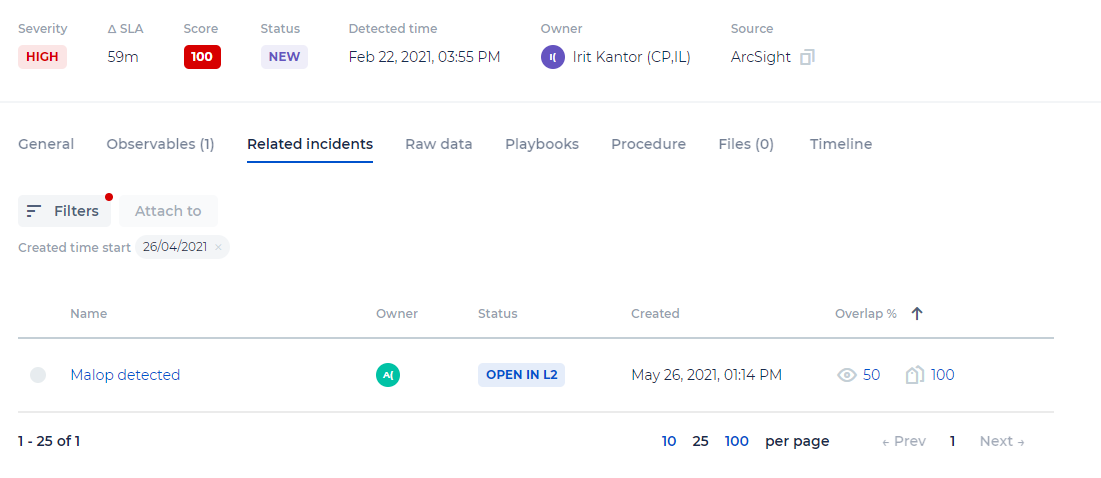
Related Incidents
The Related Incidents tab enables you to suggest to which incident an alert is related. This is based on shared observables and tags between the alert and incidents.
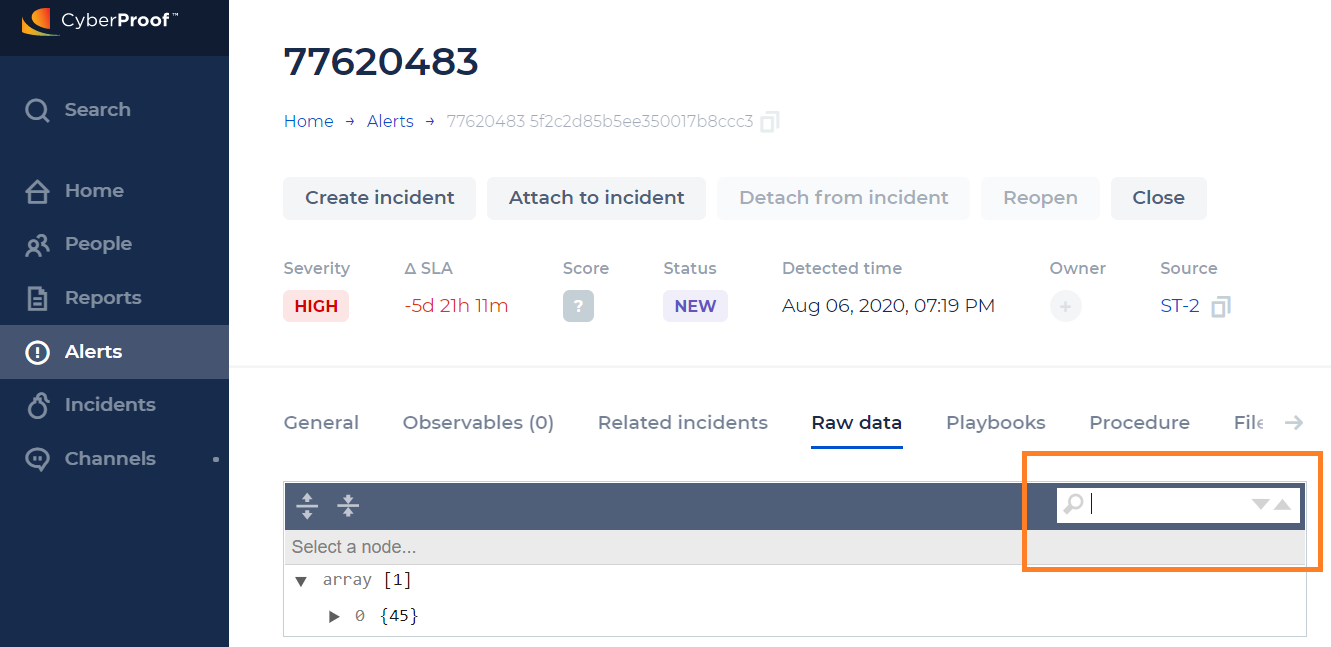
Raw Data
In the Raw data tab, you can inspect the alert’s raw data. Note that raw data can be dynamically updated as alerts come in, even if an alert is attached to an incident. Once the alert is closed, the raw data will no longer be updated.
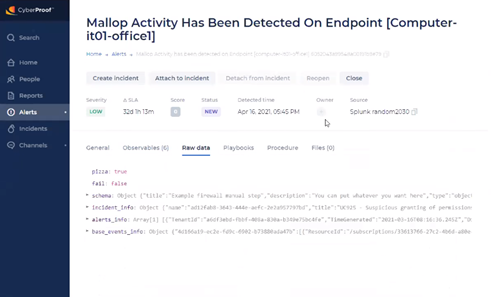
You can also search by a value in the Raw Data tab.
Playbooks
The Playbooks tab provides information on how to handle the alert.
For additional Information on playbooks, see the Alert Playbooks section of this guide.
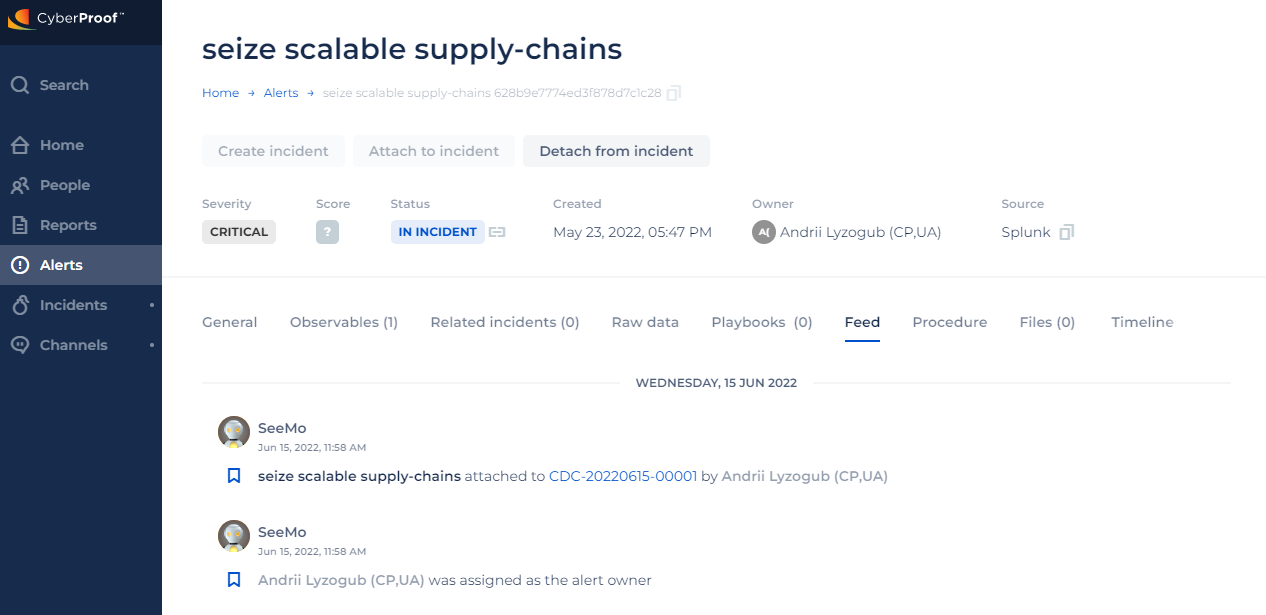
Feed
The Feed tab enables you to see updates and notifications related to the alert.
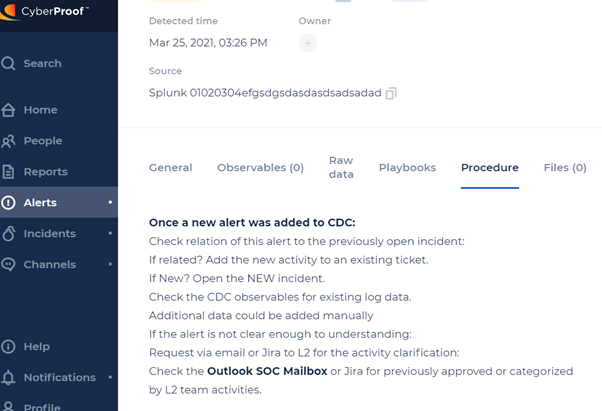
Procedure
The Procedure tab provides a general explanation of what to do with an alert. This tab can also assist analysts with performing triage.
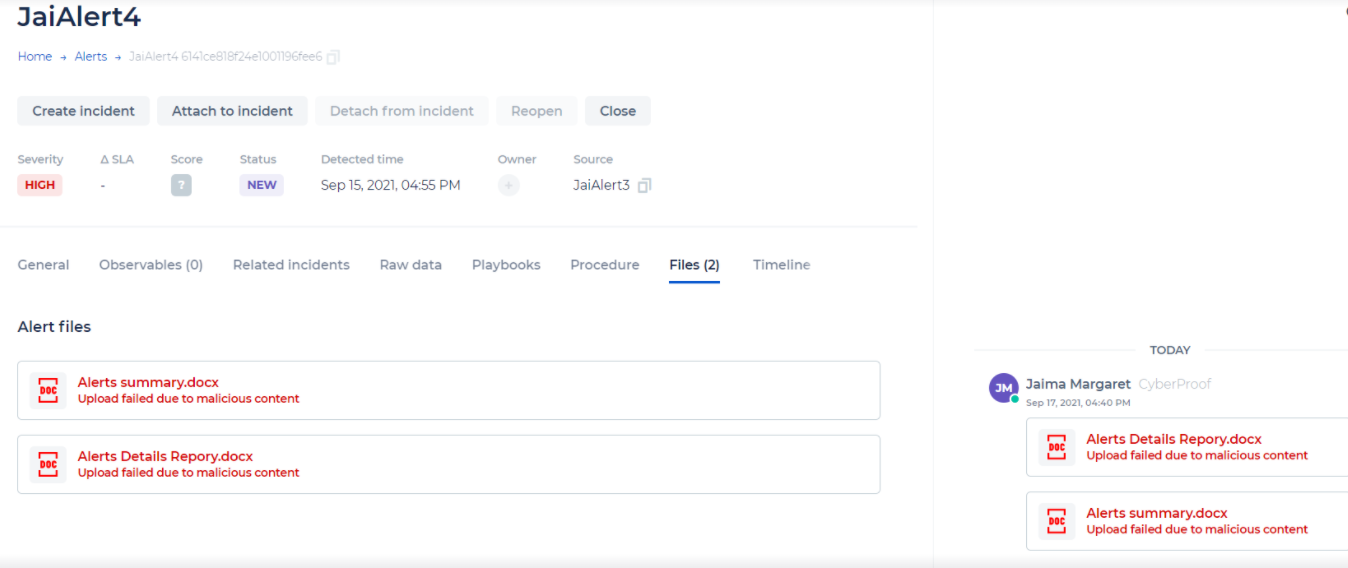
Files
The Files tab is where you can find all of the files uploaded to an incident over time. Instead of going through history in the chat, you can find any file on this tab. You can also preview and download files from here.
Users with a role of incident/channel contributor (and above) can upload files to the platform. These files will be checked for malicious content. Users with these roles can also download files that were scanned before from the CDC.
Note: You will not be able to download files that were not scanned.
In the Files tab, you can also copy the File ID in all Files appearances in the CDC. This is an integration that requires uploading a CSV file to an alert, and then providing file details as a parameter to the CLI command.
Timeline
The Timeline tab offers a timeline of the major events of the alert, and shows the events leading up to the most current item. This includes when an alert is detected, closed, resolved, reopened, etc.
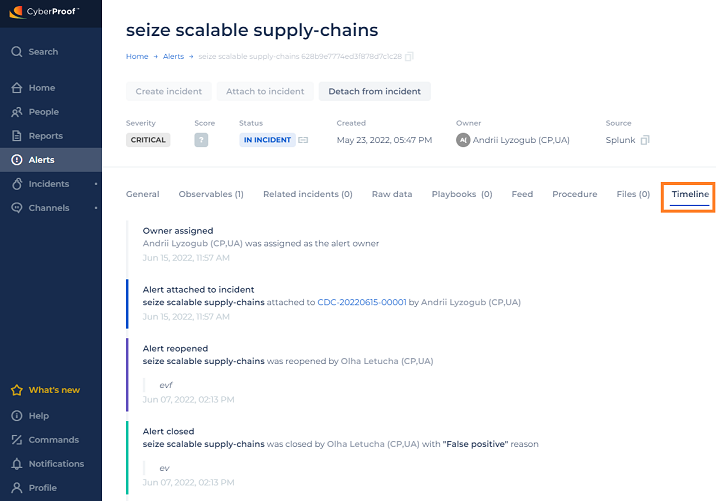
Note that the system will automatically add records whenever the following events happen:
- An alert is attached to an incident.
- An alert is detached from an incident.
- An owner is assigned.
- An owner is removed.
Chat
The Alert Details page features a ChatOps window – which supports collaboration, file upload, running commands, user mentions, and more.
You can see escalation reminder indications and Mitre ATT&CK updates here as well.
Alert Investigation
You can investigate your alert capabilities through the Alert page, as well as through the ChatOps window. See the ChatOps Window section for additional Information.
Alert Playbooks
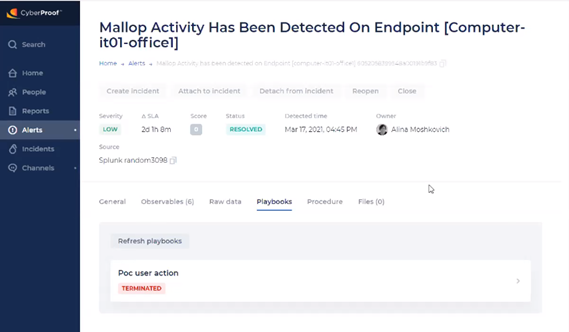
With alert playbooks, you can view playbooks and their details, monitor automation flows related to specific alerts, interact with playbooks, mark steps as done, and terminate playbooks.
Each alert can have multiple parallel playbooks running. With the Playbooks tab you can view a list of playbooks that have different statuses and see additional and more advanced details related to playbooks.
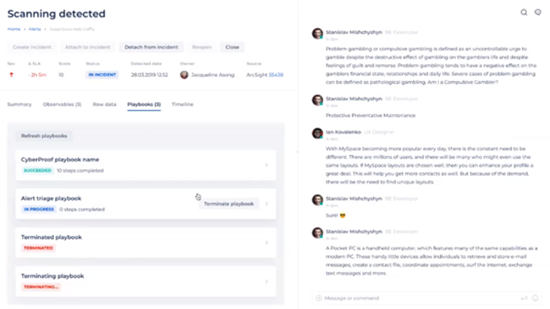
With the Playbooks tab, you can open a new playbook with information on how to handle the alert.
You can also view other playbook details such as a counter of how many playbooks you have, and a list of playbooks that have different statuses – such as Succeeded, In Progress, and Terminated/Terminating.

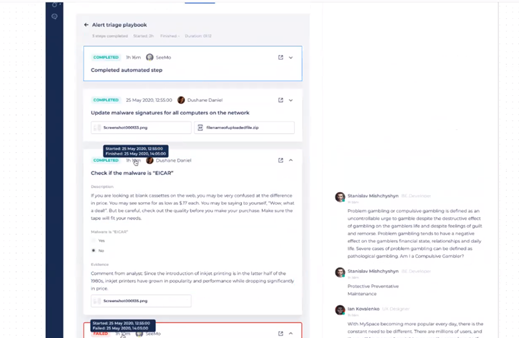
Click a playbook from the playbook list to see additional information and details about the playbook, including the sequence of steps for the playbook. These include:
- Automated steps (executed by Seemo), for which you can only see the results.
- Manual steps – for which you can see the completion time and the user who completed the step. You can also expand or collapse the steps to see details such as the name of the step, a description, etc.
Manual steps can be with or without options. Manual steps without options only display the name and description of the step - with what actions should be taken. Manual steps with options include a group of checkboxes that are required to fill in, and an optional text input field and radio button. Once you select the required options and finalize your selections here, you will see the Mark as Done button – which you can click to complete the steps.
Note: Click the Refresh Playbook button to refresh your playbooks. You should do this after each action to see an updated playbook.
Note: When changing a use case for an alert connected to an external playbook, the playbook of the alert is changed. You will see a pop-up confirming that you want to change the playbook.
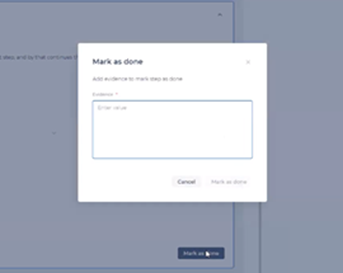
Mark as Done
When manual steps have no options, the Mark as Done button is always active. When you click Mark as Done, you will need to enter a comment; otherwise the step cannot be completed. You can also add files here.
Once finished, you will see a note in the chat that the step was completed.
Terminate Playbook
With the Terminate playbook option, you can kill all the processes that are currently running for a particular playbook. You can do this when the playbook is no longer relevant.
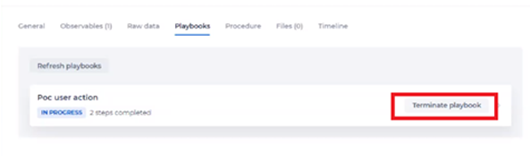
In the Playbooks tab, you can then see that the playbook was terminated.
Was this article helpful?